Every business generates 402.74 million terabytes of data every day, making it one of the most crucial components for success (Exploding Topics, 2024). They often rely on multiple data sources and platforms, which makes it challenging to gain a unified view of business operations. Combining IBM i data with insights from various platforms into a single dashboard enables more effective analysis and decision-making. This allows businesses to utilize data’s full potential to create cohesive datasets that drive strategic insights and operational efficiency. With the rising need to share existing data, enterprises are employing data integration to make informed decisions that add value to customers and impact the bottom line.
Key Insights
- Businesses relying on IBM i systems often struggle with integrating data from multiple sources, which leads to fragmented views that hinder decision-making and operational efficiency.
- LANSA BI integrates IBM i data with various platforms, transforming disparate data into unified and actionable insights.
- With a centralized dashboard, LANSA BI provides real-time analytics for businesses to monitor operations and make data-driven decisions.
- LANSA BI’s customizable dashboards offer improved visibility and detailed data analysis tailored to specific business needs while its integration methods, like cloud, flat files, and third-party tools, reduce data inconsistencies, eliminate silos, and enhance the overall quality of business data.
With LANSA BI as a business intelligence tool, you can seamlessly integrate analytical capabilities directly into your IBM i applications. Users can leverage analytical tools and features to smoothly connect to numerous data sources and combine this data in a dashboard. Its easy data integration with IBM i allows organizations to utilize data to its full potential, transforming it into actionable insights. Not only does it provide enterprises with more transparent and unified visualization of their operations, but it also helps them make data-driven decisions, which gives businesses a competitive edge.
Understanding IBM i Data Integration
The IBM i, formerly known as AS/400, is a powerful system used by countless organizations to manage mission-critical applications across various sectors, from finance to manufacturing. However, as businesses grow and adopt modern technologies, companies face many challenges in integrating IBM i data with new platforms.
IBM i integration can pose several challenges, including:
- Data incompatibility: One of the major challenges businesses face in IBM i data integration is ensuring that the data formats between IBM i and other systems are compatible. It is important for different systems to exchange and interpret data correctly without errors, inconsistencies, or losses.
- Legacy system complexity: These legacy systems often have intricate architectures, outdated technologies, and complex dependencies that make integration challenging.
- Cost: Integration project costs can escalate rapidly, especially if they require specialized solutions. For IBM i data integration, the costs can be even higher as you are required to integrate data with newer platforms that may not be fully compatible with legacy systems.
- Skill gaps: The global shortage of skilled professionals in IBM i data integration is a significant hurdle for many companies. It leads to challenges in finding experts with knowledge of IBM i systems who can seamlessly integrate data with newer platforms.
The ability to scale data integration processes efficiently ensures that businesses can handle increased data loads without sacrificing performance or reliability.
Importance of Unified Data View
Multi-platform data integration combines data from different sources to provide users with a unified view of the combined data. This is integral to various areas of business operations, including decision-making, analytics, and operational efficiency.
Here are the benefits of Unified Data View:
- 360-degree Data View: Integrating data from various touchpoints provides companies with a 360-degree view of their operations, customers, and market trends, leading to informed decision-making.
- Error Reduction: Unifying data manually frequently results in incorrect, invalid, and incomplete data sets. This is especially the case when the data is collected using several accounts and locations. Data integration synchronizes data to ensure accuracy and up-to-date reporting while preventing errors and misleading information.
- Cross-Department Collaboration: Data integration makes real-time data access and exchange between departments possible. This makes it easier to break down data silos and conduct cross-functional analysis.
- Compliance Management: Integrating data eliminates the need for manual data consolidation, which not only eliminates data silos but also maintains data consistency across platforms, which is crucial for regulatory compliance. Moreover, data integration makes regulatory compliance easier. Compliance management is significantly more effective when there is data quality, consistency, and traceability.
LANSA BI: Simplifying Data Integration
LANSA BI, an IBM business intelligence software, stands out as an advanced solution offering a flexible integration framework that supports a wide range of databases, applications, and file systems to make data integration efficient. Here are some of the data integration methods LANSA BI utilizes to simplify data processes:
- Native Database Connectors: LANSA BI provides pre-built connectors for many popular databases, such as MySQL, SQL Server, PostgreSQL, Oracle, and others.
- ODBC/JDBC Connections: It can connect to databases or data sources using ODBC (Open Database Connectivity) or JDBC drivers, allowing you to connect to virtually any data source with an ODBC/JDBC driver.
- Cloud Data Source Integration: This allows you to connect to cloud services like Google Analytics, Salesforce, Azure, AWS, and others through dedicated connectors or using APIs.
- Data Virtualization: It supports data virtualization, allowing you to access multiple databases and data sources without physically moving the data. It acts as a central platform to query and combine data from different sources in real-time.
- Flat Files & Excel Spreadsheets: LANSA BI can ingest data from flat files like CSV, Excel, and XML and map them into reports or dashboards.
- Third-Party ETL Tools: You can also integrate with ETL (Extract, Transform, Load) tools like Talend, Informatica, or Apache NiFi, which can handle the heavy lifting of data integration, transformation, and cleaning.
This reduces inconsistencies and improves data quality, allowing businesses to eliminate data silos and perform more comprehensive analytics, leading to more informed decision-making.
Unified Dashboard for Comprehensive Insights
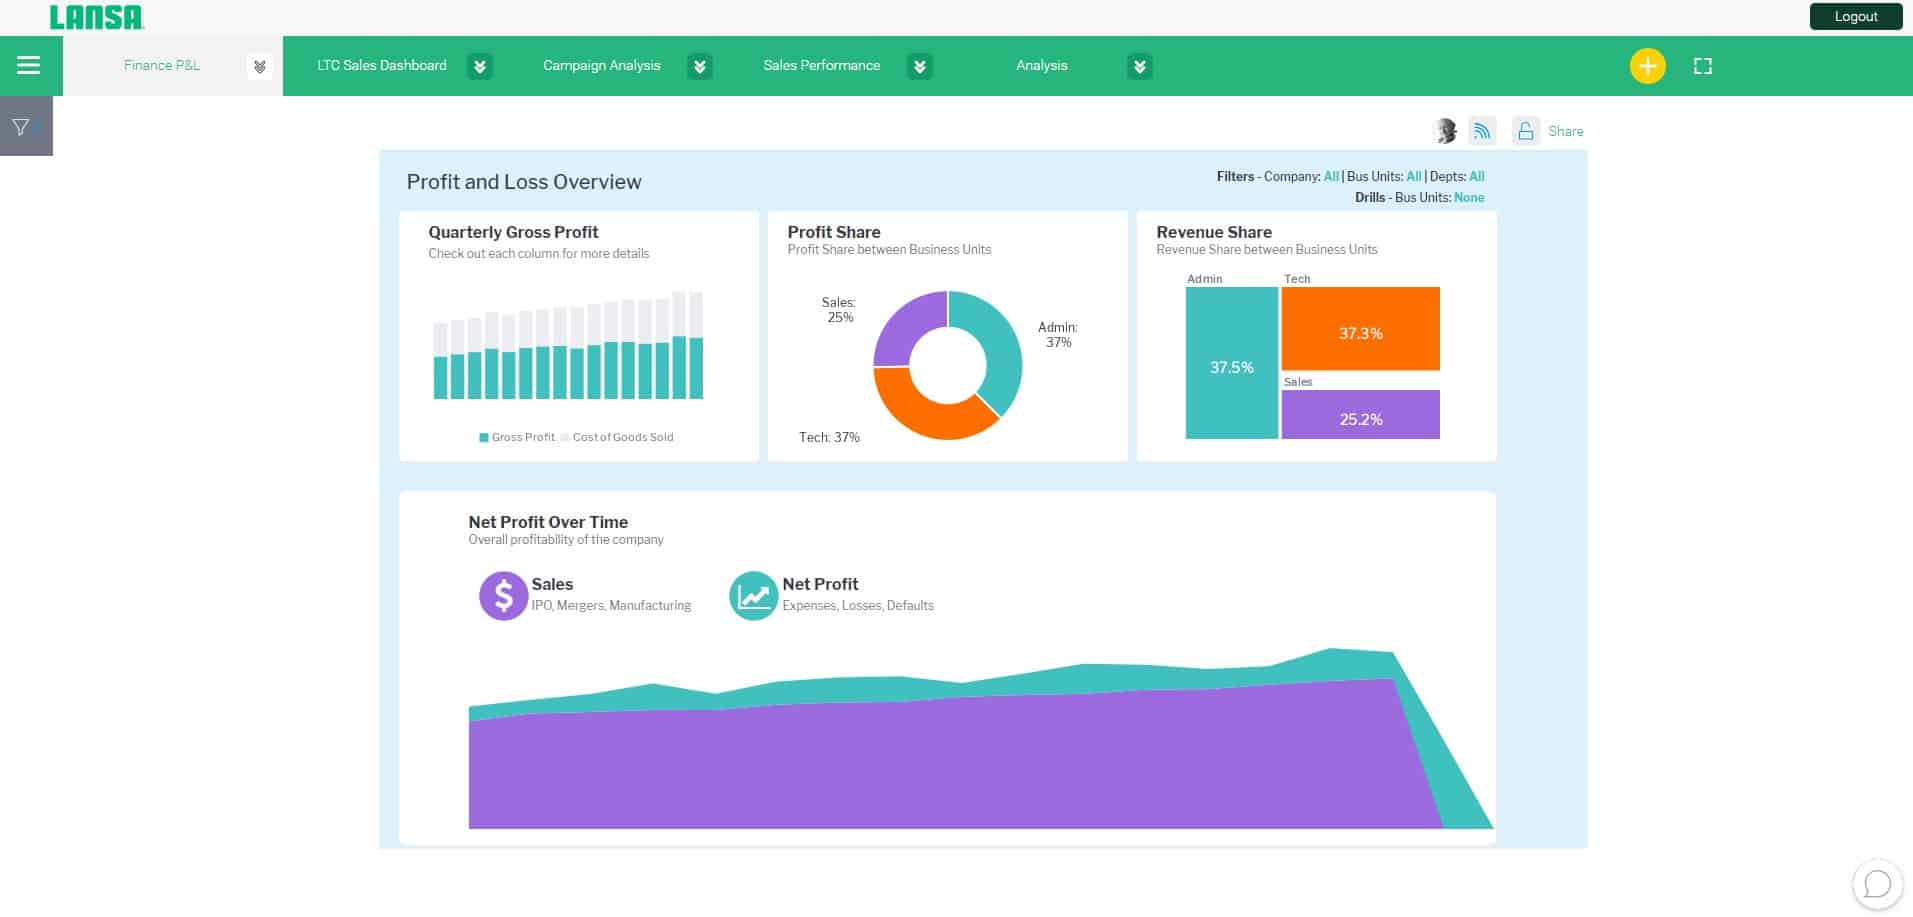
Profit and Loss Company Dashboard
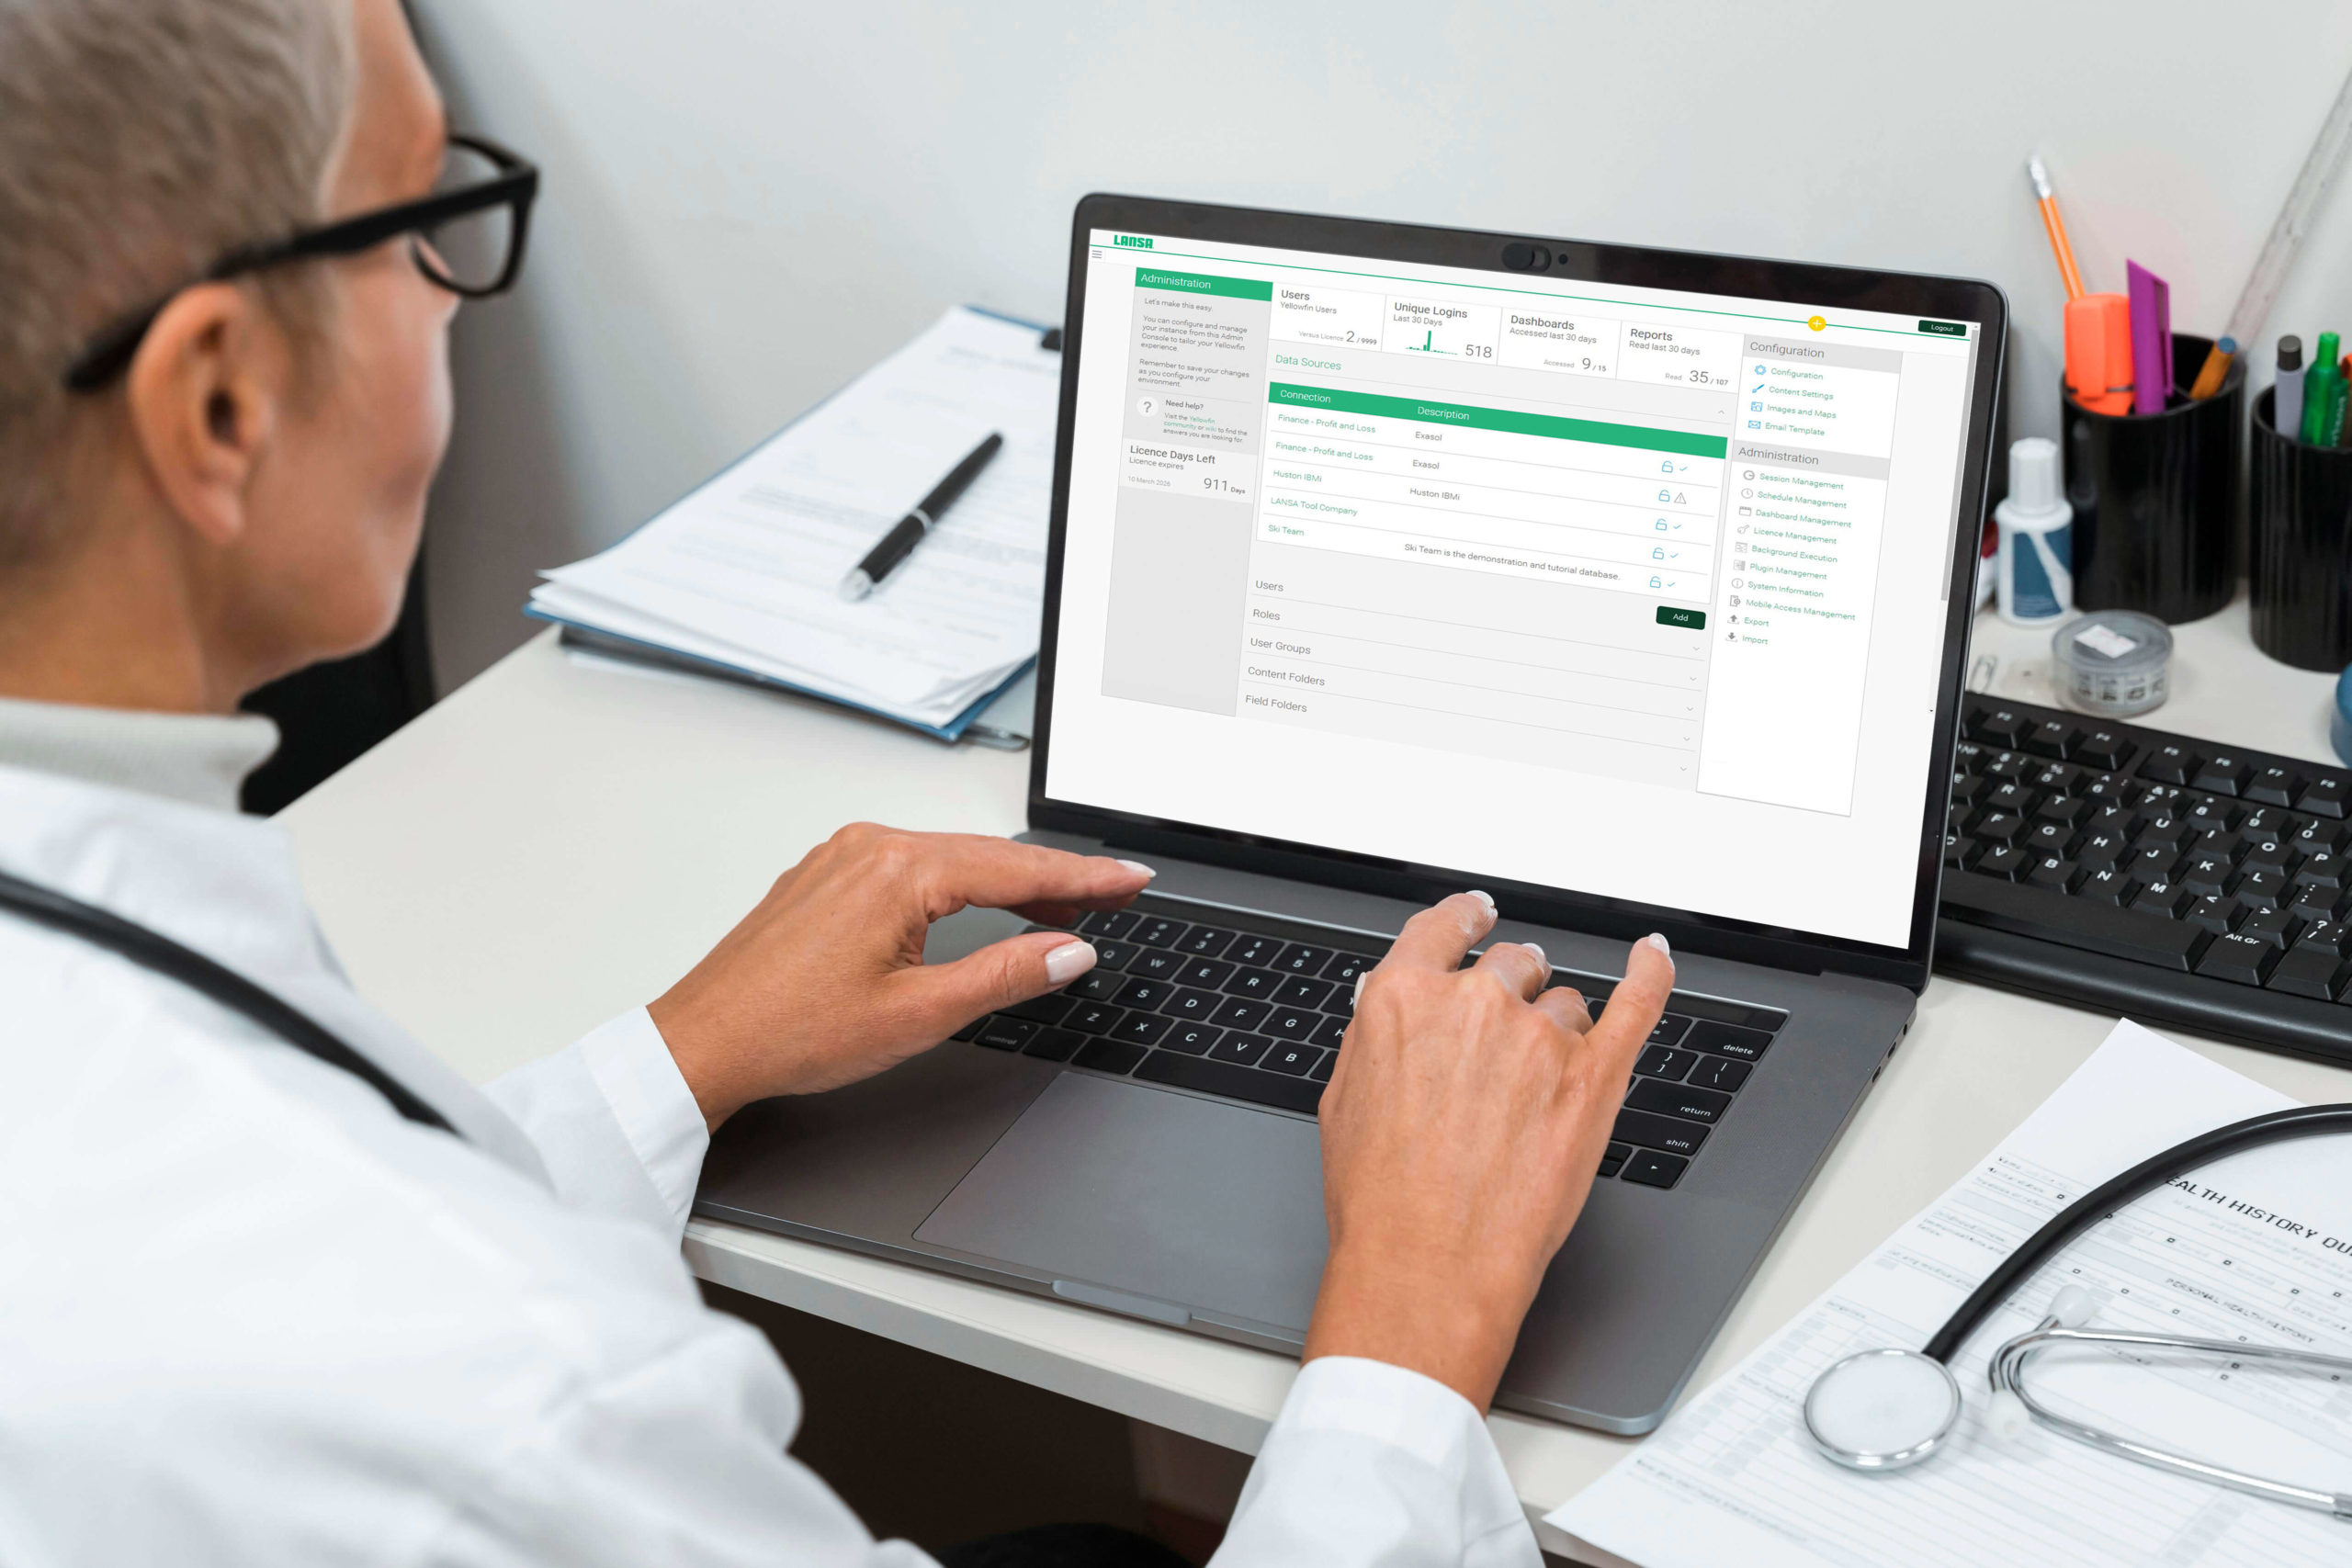
A unified dashboard serves as the central hub for data insights, combining various data sources into one comprehensive view. LANSA BI’s unified dashboard is a powerful feature that makes data integration and real-time data analysis easier. Some of the most essential features of the BI dashboard are:
- Real-Time Data Integration: LANSA BI seamlessly integrates IBM i data with other platforms, ensuring that users have access to correct and up-to-date information across all data sources.
- Customizable Visualizations: The dashboard offers flexible options for data visualization, allowing users to use customized graphs, add interactive charts, adjust pre-made widgets, and apply filters to tailor the information to specific business needs.
- User-Friendly Interface: The intuitive interface facilitates the creation, modification, and exploration of dashboards by both non-technical and technical users.
- Enhanced Decision-Making: By centralizing diverse data streams into one platform, LANSA BI simplifies complex data, leading to better decision-making, improved operational efficiency, and streamlined data management.
With customizable visualizations and interactive elements, users can tailor the dashboard to suit unique business needs, enhancing the clarity and relevance of the insights.
Discover interactive dashboards and assisted insights in this quick 6-minute video.
Actionable Insights from Integrated Data

Sales Performance Auto Analysis Dashboard
With LANSA BI’s real-time insights, you can get a comprehensive view of your business operations from day to day and modify your strategies. Actionable insights allow you to make decisions based on the conclusions drawn from the data, identify inefficient processes, and make changes to streamline your workflow. Companies can create customized dashboards with actionable insights and tailor them to their specific needs. It facilitates the simplification of your complex business data and enables you to choose the data points you want to feature and add drill-down capabilities, where users can drill down from a general view of data to a more specific one by clicking on a metric in a dashboard or report. This enables users to hone in on the data powering your results, getting into more granular details for deeper analysis.
Not only can you visualize data easily, but you can also predict future trends using predictive analytics. It is a feature of advanced analytics that forecasts future trends and outcomes using historical data. Leveraging artificial intelligence, it identifies patterns that might predict future behavior. With predictive analytics, companies can optimize existing products, better understand customer behavior, and even improve marketing strategies.
In addition, LANSA BI’s automated business monitoring feature utilizes techniques like machine learning, real-time data monitoring, and pattern identification methods to discover statistically significant variations in data automatically. This eliminates the need for manual data analysis as it continuously scans for critical changes, saving time and revealing hidden insights.
Transform Your Data Into Actionable Insights
Integrating IBM i data with multi-platform insights using LANSA BI transforms how businesses access and utilize information by aggregating data from various sources into a single and comprehensive dashboard. With this customizable dashboard, you can centralize important information so that businesses can have a holistic view of their operations, customers, and market trends, leading to informed decision-making. In addition, you can also incorporate real-time insights from different areas of your business to make decisions based on a broader range of up-to-date information. By utilizing LANSA BI’s advanced features, organizations can not only harness data to its full potential but also stay competitive in the modern business landscape by delivering data-driven decisions.
Get the Most Out of Your Data with LANSA BI
Are you making the most of your data? Many businesses are collecting data but aren’t sure of the best way to leverage it. With LANSA BI, you can generate actionable insights that drive data-driven decisions in your overall business strategy. Contact us today to unlock your data’s hidden potential. Book a demo to transform your data into actionable insights with LANSA BI.