Data storytelling imbues business communication with relevance and impact. But how you say things is just as important as what you say. Storytelling styles and narrative content both matter — and LANSA BI, an IBM business intelligence software, makes both more compelling in helping data drive organizational change.
Learn more about the power of data storytelling by watching this webinar.
With LANSA BI, communicators and stakeholders go beyond simple reporting. They produce transformational value by empowering audiences to draw more informed conclusions from data. Here’s how to tell more substantive, accessible stories that power smarter decision-making.
Key Insights
-
Data storytelling combines data, narrative, and visuals to make business insights more engaging, memorable, and actionable.
-
LANSA BI helps overcome common storytelling barriers such as complex visualizations, outdated data, and fragmented systems.
-
Personalized, interactive storytelling formats like Data Stories and Data Present boost engagement and cater to different audience needs.
-
Self-service analytics and NLQ tools empower users across all skill levels to explore and share insights without relying solely on data teams.
-
Cohesive storytelling experiences are supported by LANSA BI’s embedded reports, streamlined workflows, and unified dashboards.
-
Real-world use cases show how LANSA BI helps improve decision-making in industries like healthcare and finance by transforming how teams engage with data.
What Is Data Storytelling?
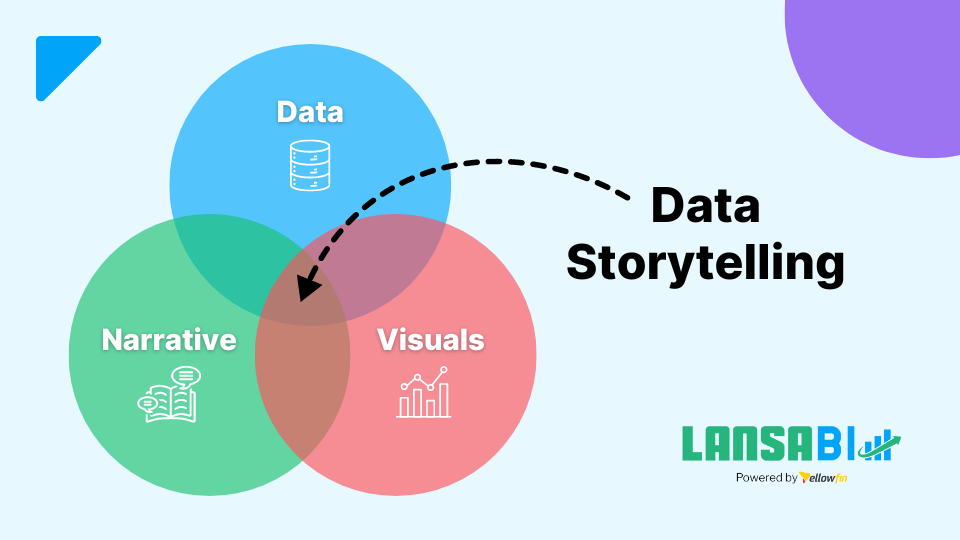
Data storytelling is the act of communicating data insights via visualizations and narratives.[1] According to Harvard Business School Marketing Coordinator Catherine Cote, the process involves three core components:
- Data: Data analysis lays the groundwork for the story you’ll tell. While there are different analytical approaches, your data must be accurate and complete to generate valid insights.
- Narrative: This is the juicy story. The narrative specifies which insights you’ll focus on. It should also reveal the data’s context and actionable recommendations for your audience.
- Visuals: Visualizations enhance memorability and clarity. Good storytellers use them to both highlight the data and reinforce the narrative.
Why Data Storytelling Matters
Data storytelling is about more than just talking about data. It’s a way to get the audience — including leaders, peers, clients, and other stakeholders — invested in the journey. Effective data storytelling skills are the difference between shared information and actionable organizational wisdom:
- People prefer stories over pure data: Narratives naturally kick mental engagement into high gear, compelling audiences to pay attention.[1]
- Data storytelling increases the likelihood of “a-ha” moments: Storytelling reframes data in meaningful and relevant ways. This can help people draw inspired conclusions and notice high-level connections. It also boosts the odds of remembering data.[2]
- Data storytelling enhances accessibility: Not all audiences are technically minded. Narrative explanation empowers everyone to engage with data and make better decisions.[3]
- Data storytelling unifies data narratives: Every dataset is open to interpretation. Storytelling helps align stakeholders with an organizational perspective. It permits open debate and independent analysis while guiding audiences toward optimal conclusions.
Where Data Storytelling Falls Short
Data storytelling isn’t perfect. The potential may exist, but implementations don’t always live up to it. There are a few common reasons why, particularly in the IBM i context:
Ineffective Narratives
The stories you tell with and about data must be compelling. However, this is harder than it sounds. Even in shared organizational environments, audiences don’t always prioritize the same insights. Time also plays a role — data can lose relevance with age.
LANSA BI makes data stories more timely, increasing their significance to audiences. It lets contributors, analysts, and business leaders collaborate, making it easier to adopt a narrative tone that boosts persuasiveness and strikes a chord with diverse stakeholders. LANSA BI’s Auto Refresh also keeps information accurate and up-to-date.
Overwhelming Complexity
There’s such a thing as communicative overload, and visualizations are a prime example. Studies have found that packing tons of information into your presentations doesn’t leave non-technical audiences feeling better informed. Instead, it often intimidates or overwhelms them.[4]
LANSA BI helps communicators selectively zero in on accessible narratives, using data views and visual elements to reinforce and organize key points. When it’s time to present, private and external reporting channels let you push different messages to different audiences. Each viewer enjoys an interactive, tailor-made insight consumption experience.
Low Engagement
Data storytelling needs substance, but a fancy-looking PowerPoint won’t cut it. If people have to work to glean insights from your narrative, they’re less likely to make it to the finale. Attention spans come at a premium, so your message must be engaging and digestible.
One 2024 study found that audiences identified relevant findings faster with the help of data storytelling.[5] Conventional visualizations may boost retention, but they’re less efficient than a solid narrative at communicating the big picture.
Unfortunately, many analytical experts lack storytelling proficiency. Crafting and sharing compelling stories fall by the wayside, leading to low engagement.[6]
LANSA BI’s storyboards let audiences play with data to boost uptake and retention. Viewers can explore the facets that make information interesting and discover meanings that resonate with them.
With LANSA BI, storytellers get to choose how they share and build more cohesive narratives with multiple formatting options: Data Stories and Data Present. These modes also offer convenient, mobile-ready options for consuming data in a news-like format.
Data Stories allows users to create narrative-driven reports that blend data insights with contextual commentary, while Data Present functions as a data presentation tool similar to slide-based presentations like PowerPoint but with the ability to embed live reports and charts.
Lack of Cohesion
Data storytelling’s power to simplify messages hides its complexity. From data sources to platforms, there are many moving parts behind the scenes. It can be hard to tell an impactful story, especially with legacy software.
LANSA BI powers cohesive storytelling starting with behind-the-scenes narrative building. Communicators can focus on meaning instead of struggling to master data-wrangling methodologies thanks to augmented analytics tools that facilitate self service analytics. Intuitive workflows and automation let users skip straight to insight generation.
LANSA BI also reduces cognitive load because there’s less to remember. For instance, Stories and Present modes collate data and insights from different tools and projects into one platform. Stakeholders can update organizations more uniformly without having to context-switch. Present mode even includes familiar graphic tools that anyone can use to create polished presentations.
Another powerful feature lies in LANSA BI’s operational reporting. You can embed BI reports directly into updates, so users never have to search for insights. Relevant data is always on hand, making it easier to apply what you learn.
How To Tell More Compelling Stories With LANSA BI
Using LANSA BI effectively is easy, thanks to its ergonomic workflows and innovative features.
Workflow Tips
- Use LANSA BI for data exploration: Storytelling starts with discovery, so lay the foundation before building visualizations. Try using LANSA BI’s NLQ queries and custom views to explore datasets from new angles and unearth hidden gems.
- Ditch data team bottlenecks: Data analysts play crucial roles in furthering organizational understanding. However, they shouldn’t be your sole source of answers. Make analysis a team effort by using LANSA BI to let all stakeholders actively participate in analytics.
- Build data visualizations into existing dashboards and IBM i apps: LANSA BI’s native integration facilitates data-driven decision-making and literacy at all organizational levels. Deliver insights where they’ll have the greatest impact.
- Encourage employees to share their experiences: Use LANSA BI’s employee blogging features to establish a data-first organizational culture. Stakeholders make excellent evangelists, so let them promote narratives of how they use data and inspire others to do the same.
- Use LANSA BI to keep people invested in their work: Your project management statistics shouldn’t just be for leaders. Embed updates directly into dashboards so that everyone can see progress, wins, and areas needing improvement.
Discover how data storytelling can drive smarter business decisions in our recorded webinar.
Real-Life Inspirations
Serving Patients with More Efficient Appointment Practices
In a modern healthcare system, LANSA BI could be used to refine admissions practices by helping stakeholders understand and act on data with customer-centric dashboards. By combining vibrant dashboards with automatic change updates, users can save time in identifying statistically significant signals.
Managing Hospital Incident Data for Better Care
In a healthcare setting that manages hospital incident data, LANSA BI can guide end-users within existing legacy applications and provide advanced analytics with rich, interactive storytelling elements to support smarter decision-making.
Gaining Perspective on Complex Lending Data
For organizations dealing with complex financial data, LANSA BI can be utilized to build clean financial management dashboards that expose lending patterns and KPIs across different operational contexts.
Understanding Customer Rewards Performance
For financial institutions looking to analyze customer rewards programs, LANSA BI’s Story widget and visualizations can help bring data to life to increase engagement by contextualizing performance across various retail categories.
Conclusion
Data storytelling is a powerful option for driving messages. It can boost retention and make insights more actionable, but it’s not flawless. Your strategies for crafting, telling, and sharing your story determine whether it will resonate with readers.
LANSA BI enhances data-driven teamwork with real-time analytics, promoting organic, relevant insight generation. It lowers the technical barriers that cause narratives to get lost in translation. In the process, LANSA BI enhances understanding, promoting more intelligent decision-making.
Discover more about integrating business intelligence into IBM i applications by watching this webinar. To see LANSA BI in action, check out this showcase, or get a demo.
References:
[1] “Data Storytelling: How to Tell a Story with Data.” Accessed: Jul. 17, 2024. [Online]. Available: https://online.hbs.edu/blog/post/data-storytelling
[2] “The Importance of Data Storytelling | JCU Online.” Accessed: Jul. 17, 2024. [Online]. Available: https://online.jcu.edu.au/blog/the-importance-of-data-storytelling
[3] “What is Data Storytelling? | A Definition from TechTarget.” Accessed: Jul. 17, 2024. [Online]. Available: https://www.techtarget.com/searchcio/definition/data-storytelling
[4] “Data Storytelling 101: How to Tell a Powerful Story with Data.” Accessed: Jul. 17, 2024. [Online]. Available: https://storyiq.com/data-storytelling/
[5] “Data Storytelling in Data Visualisation: Does it Enhance the Efficiency and Effectiveness of Information Retrieval and Insights Comprehension?” Accessed: Jul. 17, 2024. [Online]. Available: https://dl.acm.org/doi/fullHtml/10.1145/3613904.3643022
[6] “Why data storytelling is so important—and why we’re so bad at it | Deloitte Insights.” Accessed: Jul. 17, 2024. [Online]. Available: https://www2.deloitte.com/xe/en/insights/topics/analytics/data-driven-storytelling.html