Business data is a precious commodity — to the point where, according to Gartner, “data is now recognized as the most important asset of an organization” [1]. However, it’s often only prospected by analytical specialists and data scientists. So how can you give more “miners” access to your data gold mine? Self service analytics can enable more decision-makers and everyday employees to use data nuggets to add value to their decisions.
Key insights to help you leverage self-service analytics
- Self service analytics remove data silos, increase reporting efficiency and data accessibility across your organization.
- You can increase the effectiveness of your self- service analytics system using automated data pipelines and catalogs because they make access more straightforward.
- With LANSA BI, you build business intelligence reports using native DB2 database integration, enabling self service analytics for IBM I applications.
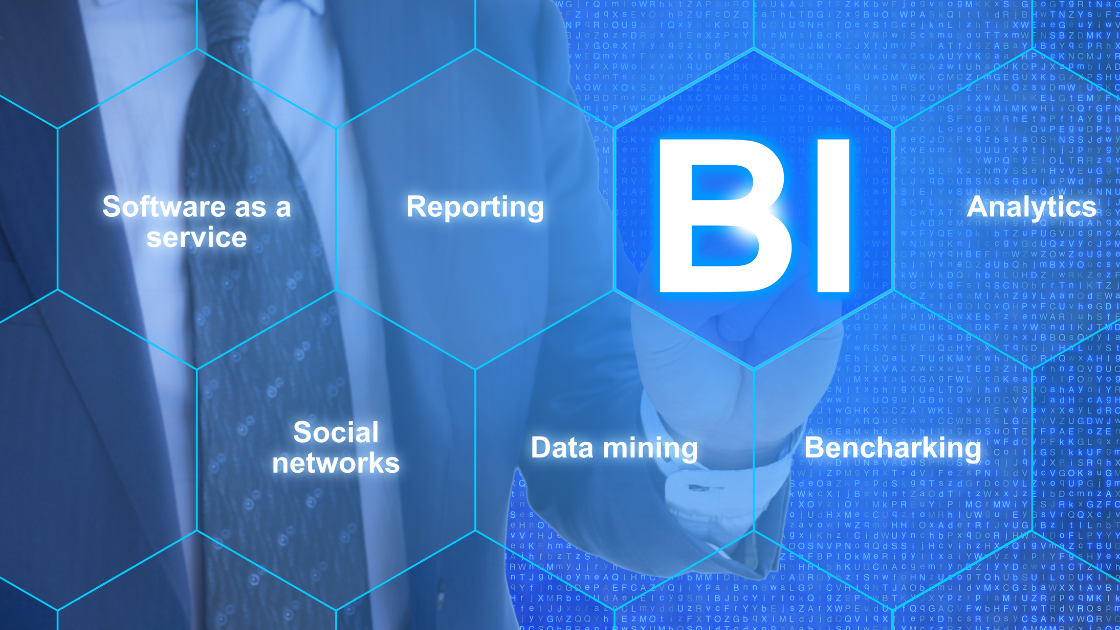
What is Self Service Analytics?
Self service analytics is a type of business intelligence refers to giving users the ability to analyze data without having to depend on business intelligence experts or the IT department. This empowers a wide range of users to build insights using accurate, real-time data. As a result, stakeholders across your organization can make more actionable, reliable decisions.
Self-Service Analytics Benefits
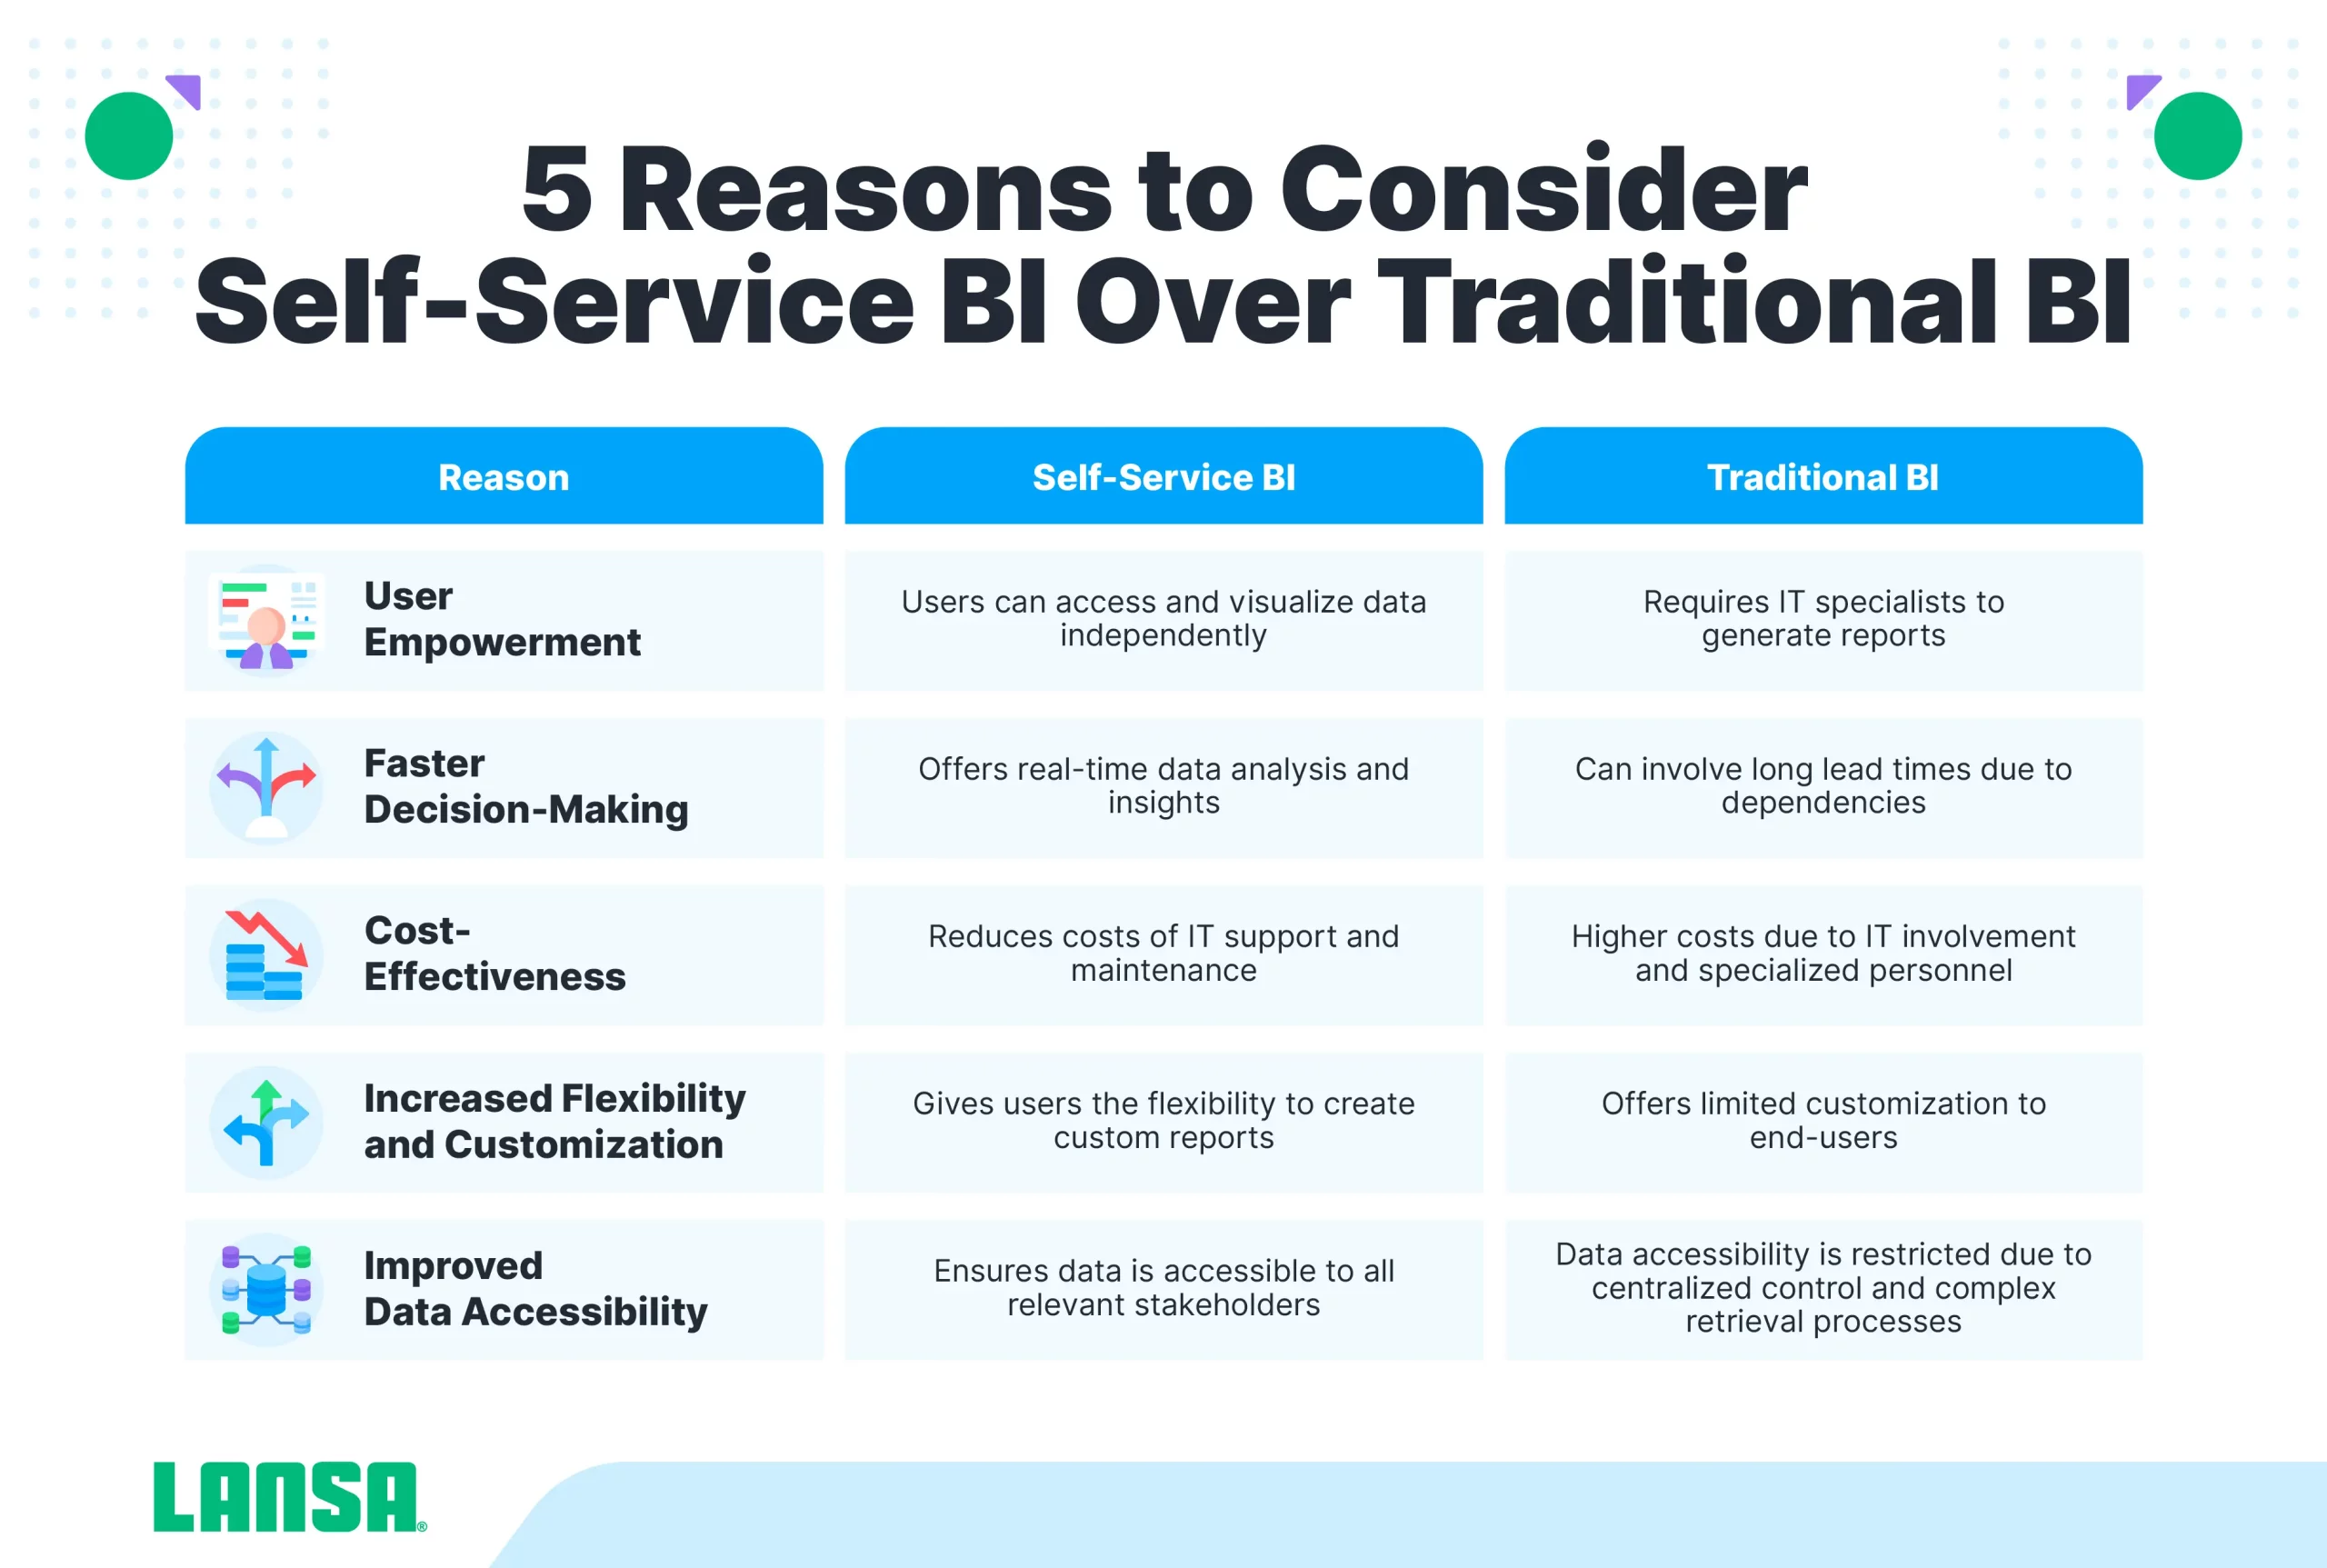
Self service BI turns everyday employees and other users into analytical specialists, giving them the tools needed to access data, use it to collaborate, and generate compelling reports. This gives users of business intelligence self-service software distinct advantages in the business landscape.
Preventing Existing Data Silos
There are many examples of self-service analytics solutions that prevent data silos. A self-service analytics system prevents users from having to rely on others to provide data only they have access to. By removing these silos with self-service BI software, you reduce the workload for your IT team and data specialists. It also reduces the time it takes for others to make data-powered decisions.
For example, the Mastercard Business Intelligence Platform, a self service model, removes data silos to empower a range of stakeholders to make better decisions. For instance, it gives executives access to sales and performance data that would normally only be available to sales or marketing staff. Because the BI solution un-siloes this information, executives don’t have to message sales and marketing staff to ask for reports before making important decisions. They can simply pull up their own self service data.
One way to remove data silos is by using natural language queries. This enables users to use everyday language to query databases and surface insights. When users don’t have to use database-specific language, getting the information they need is both easier and faster.
Increase Reporting Efficiency
Users can perform self service reporting — without having to rely on someone else — which makes the analytical process faster and more efficient. When analytics is relegated to data scientists or other specialists, other stakeholders have to waste time messaging these experts for the data needed to generate effective reports. But with self service analytics, you have the information and tools you need at your fingertips. Therefore, generating a report can take moments instead of hours—or longer.
For example, suppose you’re a CFO and you want to use business intelligence self service software to generate reports regarding your company’s financial performance. With LANSA’s IBM iBI platform, you can start by clicking and dragging your way to a dashboard that automatically integrates financial data from an SQL database. You could include charts and graphs showing gross profit by quarter, the profit and revenue shares of individual product lines, net profit, and more.
When it’s time to generate a report that weaves in some or all of these metrics, it only takes a few clicks and a few minutes. There’s no need to call in the IT team or data specialists for help.
Improve Data Accessibility and Collaboration (Across Teams)
Because self service analytics gives more users deeper access to data, it also paves the way for using this data to team with others to conquer business challenges. When brainstorming ways to address issues, you can loop in the entire team, providing them with actionable, accurate, real-time data. When everyone uses the same common source of truth, group problem-solving is more efficient and effective.
To illustrate, suppose you’re a sales manager, and while your North American sales are strong, you want to boost sales in Europe. You quickly create a dashboard with LANSA BI that includes data and charts for regional sales in North America, Europe, Asia, Latin America, and Australia.
You could then share this dashboard with the European product manager. She then adds a chart that shows the cost of goods sold (COGS) in Europe and shares it with you.
You then share the new dashboard with the marketing manager for Europe.
In a Teams call, each stakeholder uses the data shared in your LANSA BI analytics tool. Using this information, you decide as a team which products will perform best in the European region, how much it will cost to produce them, how to get them to market, and pricing levels.
Generate More Accurate Results
When users have tools to access data on their own, you cut back on the number of errors that can result from manual data downloads and processing. Since you can link a self-analytics solution to a central database, everyone gets access to the same information. You can also set up an automated data cleaning system that ensures the data is both accurate and immediately actionable.
For example, when you integrate IBM Db2 into LANSA BI, everyone who crafts their own BI tool can take advantage of accurate, real-time data. There’s no need for manual extracting, transforming, and loading (ETL) because you can automate these processes with LANSA BI. As a result, everyone who uses the system for analytics gets accurate information and results.
Empower Users to Customize Reports and Dashboards
When armed with self service analytics, users have the freedom to create reports to answer important questions or solve pressing business problems. Using a self service BI solution with customized dashboards is far more efficient than traditional data analysis. This may involve scrolling through dozens of columns in an Excel sheet or manually coding your way to an analytical tool.
Using common self service analytics tools, people can generate their own dashboards and reports, regardless of the department they work under. With the right software, you can even automate deep analytics in your reports and dashboards.
For instance, with LANSA BI, you can quickly generate a dashboard by selecting the parameters you want. Then, you can right-click on a chart to auto-analyze the data. You can have LANSA BI either explain or compare the data. In this way, users can perform more granular analysis and enable fast, automated storytelling.
Reduce Dependency on IT Departments
When regular users have easy access to data, they don’t have to rely on the IT team to guide them through the analytics process. In this way, you save them time because they can get right to work without waiting for assistance. You also free up the IT team to focus on tasks that push your business toward its goals.
With less user-friendly data analysis solutions, many have no choice but to reach out to IT. For example, in addition to choosing the data you want to analyze, some software also requires you to provide a valid SQL statement for returning the data, manually type in column names, and set up SQL statements for search functions as well.
On the other hand, with LANSA BI, there’s no need to worry about complicated configurations. Users just select the data they want to analyze — and let the IT team continue its other important work.
Increase Data Literacy for Employees
By empowering employees with self service analytics, you give them the ability to analyze, manipulate, and reason with others using data. This supports a data-driven culture, and it can also reduce employee workloads. Some employees may be perfectly comfortable with talking about high-level business concepts. But they may feel uneasy when they have to dig through many rows of numbers or fumble through complex configurations to perform analysis.
The process of clicking and dragging is far more user-friendly, however. Instead of muddling through confusing spreadsheets, they can leverage LANSA BI to quickly choose the parameters they want to analyze. For example, after creating a dashboard, a product manager can instantly see the relationships between individual projects, their cost, and delivery timelines. They can also automatically generate data explanations they can use as they explain project strategy to employees, executives, and other stakeholders.
Key Features of a Self-Service Analytics Tool
To maximize its usefulness, you’ll want to make sure your self-service business intelligence tool has the following features, all of which make it easier to implement and a more natural extension of your current workflows.
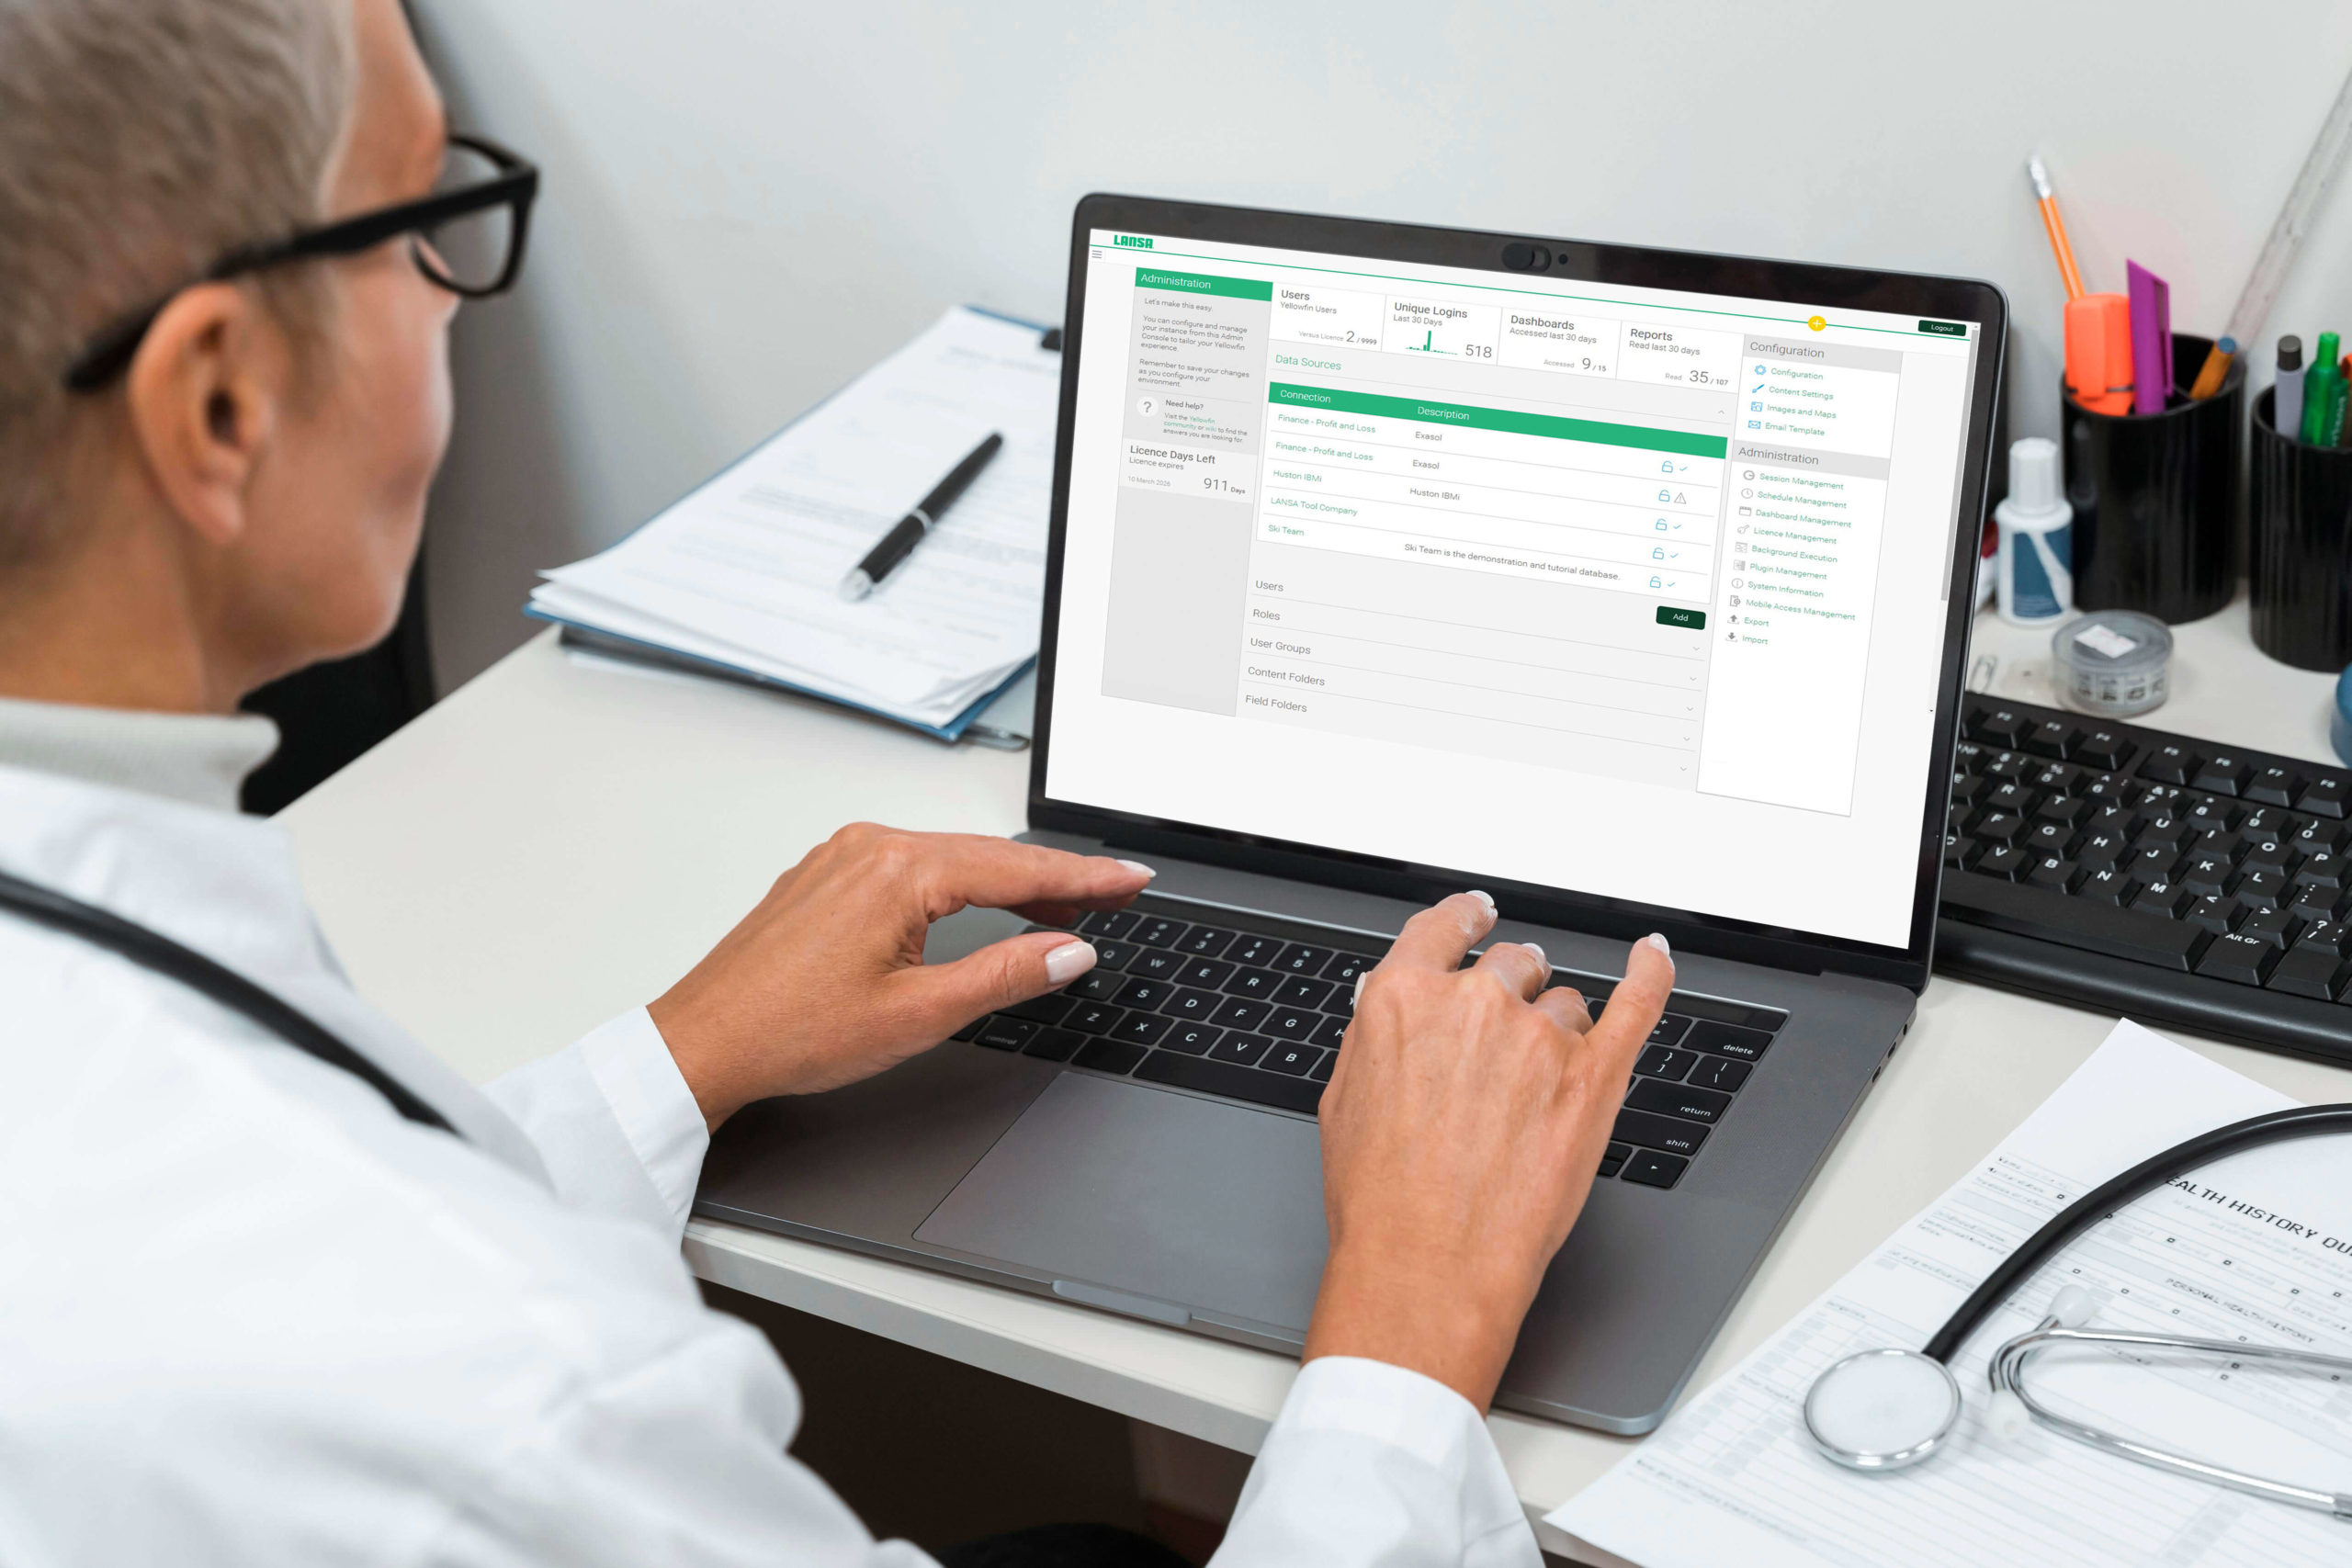
User-Friendly Interface
The interface should be intuitive, inviting users to explore data in a straightforward manner. This means the system should be easy to navigate and enable users to customize its layout to suit individual workflows.
LANSA BI’s user interface is easy to navigate because it features intuitive layouts that make it easy to choose data to analyze, click for deeper insights, and adjust the parameters of your analytics tool.
Secure and Reliable
When people can access your data without proper authorization, you expose yourself to data theft, corruption, or even extortion. Therefore, it’s crucial to have a robust security system in place. This may involve aligning your self service analytics with ISO 27001, GDPR, Privacy Shield Framework, and SOC 2 Type II compliance requirements. By ensuring your platform is in line with these standards, you can minimize the chances of people gaining unauthorized access.
With LANSA BI you can incorporate built-in regulatory checklists that can serve as the security foundation of your self service solution.
Access to Diverse Data Sources
A BI self service solution with access to a wide range of data sources enables more insights for different kinds of users. For example, users from the sales department, HR, and product development could all use the same self service analytics solution if it has access to the data pertaining to each department.
Since LANSA BI integrates your full scope of data from across your IBM i applications, it eliminates data “blind spots” that corrupt your tool’s effectiveness.
Collaborative
By encouraging collaboration, you can prevent users from duplicating their efforts and accidentally creating redundant insights with limited value. As they share reports with each other, they can disseminate insights to the rest of the team, which results in a wider, more comprehensive knowledge base.
Collaboration is much easier with LANSA BI because it’s visually appealing and simple design make it more accessible to a wider range of users. Since it’s simple to work within LANSA BI’s straightforward interface, users feel more comfortable sharing their analyses with others.
Integrated BI tools
Integrating BI tools in your self-service analytics solution gives your teams access to more data without forcing them to navigate between different applications. In this way, they can incorporate real-time self service data analytics, making more effective decisions without having to leave the app they’re using.
Unless you have a self-service analytics platform that supports this functionality, you may end up with disparate analytics tools. However, with LANSA BI reporting, you have the features you need to employ embedded analytics across your IBM i environment. Your teams can then perform analytics on their own without having to leave the app they’re using.
Self-Service Analytics – Best Practices
Your self-serve analytics system will be more effective if you use the following best practices, each of which shortens the timeline for enabling users to use data to steer your company in the right direction.
Data Pipelines
With automated data pipelines, you have a data management system for when you need to replicate, transform, and ingest data, moving it into a central data warehouse or lake. This paves the way for a wide range of data integration your company can leverage for deeper analyses. Your users benefit from data that’s both ready for analytics and delivered in real time.
Data Catalogs
When you incorporate data catalogs, you give users access to the data they need to perform analytics in a way that’s easy to navigate. You can also structure your catalogs so they conform to governance standards—both internal and those imposed by authorities.
Data Governance
Your architecture can be built around a governance layer that ensures your system is secure and compliant. This makes it easier to prevent the wrong people from accessing your systems. In addition, you can use your governance-based infrastructure to enforce data quality and usage controls.
Feedback
Using continuous feedback loops, you can make your system progressively more effective. As you consider and implement user suggestions, you better meet their needs, which also can improve adoption in the long run. In addition, you should track metrics regarding usability and the speed at which user issues get addressed. Using these metrics, you can objectively assess how well you implement suggestions and fix problems.
Get Started with Self-Service Analytics
By providing self-service analytics, you give wider access to valuable data to those who need it to make more effective decisions. If your self-serve analytics tools have the features listed above, they’ll meld well with user workflows and provide a user-friendly experience. By keeping the above best practices top-of-mind, you can create a system that works for a wide swath of users and continues to improve as time passes.
Connect with LANSA today to learn more about the potential for self-service analytics in your business.
References:
[1] Gartner, “Gartner Data & Analytics Summit,” Gartner, 2023. https://www.gartner.com/en/conferences/na/data-analytics-us/conference-resources/brochure (accessed Feb. 19, 2024).