In modern business, information is not just power; it’s the compass that guides decisions, shapes strategies, and drives success. The ability to harness data effectively is what sets leading organizations apart from the rest. This is where business intelligence (BI) comes into play. It is the bridge that helps you transform raw data into actionable insights.
In this comprehensive guide, we will explore BI reporting, explain its significance, and provide you with insights on how to make the most of this powerful BI tool. Let’s get started.
What is BI Reporting?
Business intelligence reporting is the process of collecting, analyzing, and presenting data to assist with informed decision-making within an organization. It is the art and science of transforming data into visual, digestible formats that allow stakeholders to understand complex information, identify trends, and make decisions with confidence.
The Crucial Role of BI Reporting
Business intelligence reporting is the foundation of data-driven decision-making. Here are some of the areas where BI reporting proves its worth:
- Strategic planning: It enables leaders to set realistic goals, identify growth opportunities, and mitigate risks.
- Performance monitoring: It allows you to track key performance indicators (KPIs) in real-time, helping you react quickly to changing circumstances.
- Customer insights: It gives you a 360-degree view of your customers, enabling personalized marketing and improved customer experiences.
- Operational efficiency: It helps optimize processes, reduce costs, and streamline operations.
How Does BI Reporting Work?
Business intelligence reporting refers to the process of gathering business data from various sources, preparing and analyzing it, and creating reports to provide actionable insights. It typically involves extracting data from various sources like databases, cloud applications, social media APIs, and files, then processing and transforming the data to make it more usable. Tools like SQL and ETL (Extract, Load, Transform) are often used to pull data from these sources and standardize them.
Once the data is prepared, it can be loaded into a data warehouse or database optimized for analytics and organized into relevant categories like sales, inventory, finance, and HR. BI tools can then access the structured data to generate interactive reports and dashboards with metrics, KPIs, and visualizations. These reports help even non-technical users to spot trends, patterns, and anomalies that would be hard to notice in raw data.
BI reports encapsulate the insights derived and communicate them effectively to business users. Depending on the audience, reports may be interactive with filtering and drilling down but can also be used to generate static files, such as PDFs, that can be delivered via email. The goal is to provide the right data to the right users at the right time, enabling data-driven business decisions and strategic planning.
Here are some of its fundamental components:
Data Visualization
Data visualization is a critical aspect of BI reporting. It involves presenting data in a graphical or visual format, such as charts, graphs, heat maps, or maps. By visually representing data, it becomes easier to identify patterns, trends, and outliers. Data visualization enhances understanding and enables stakeholders to make data-driven decisions quickly.
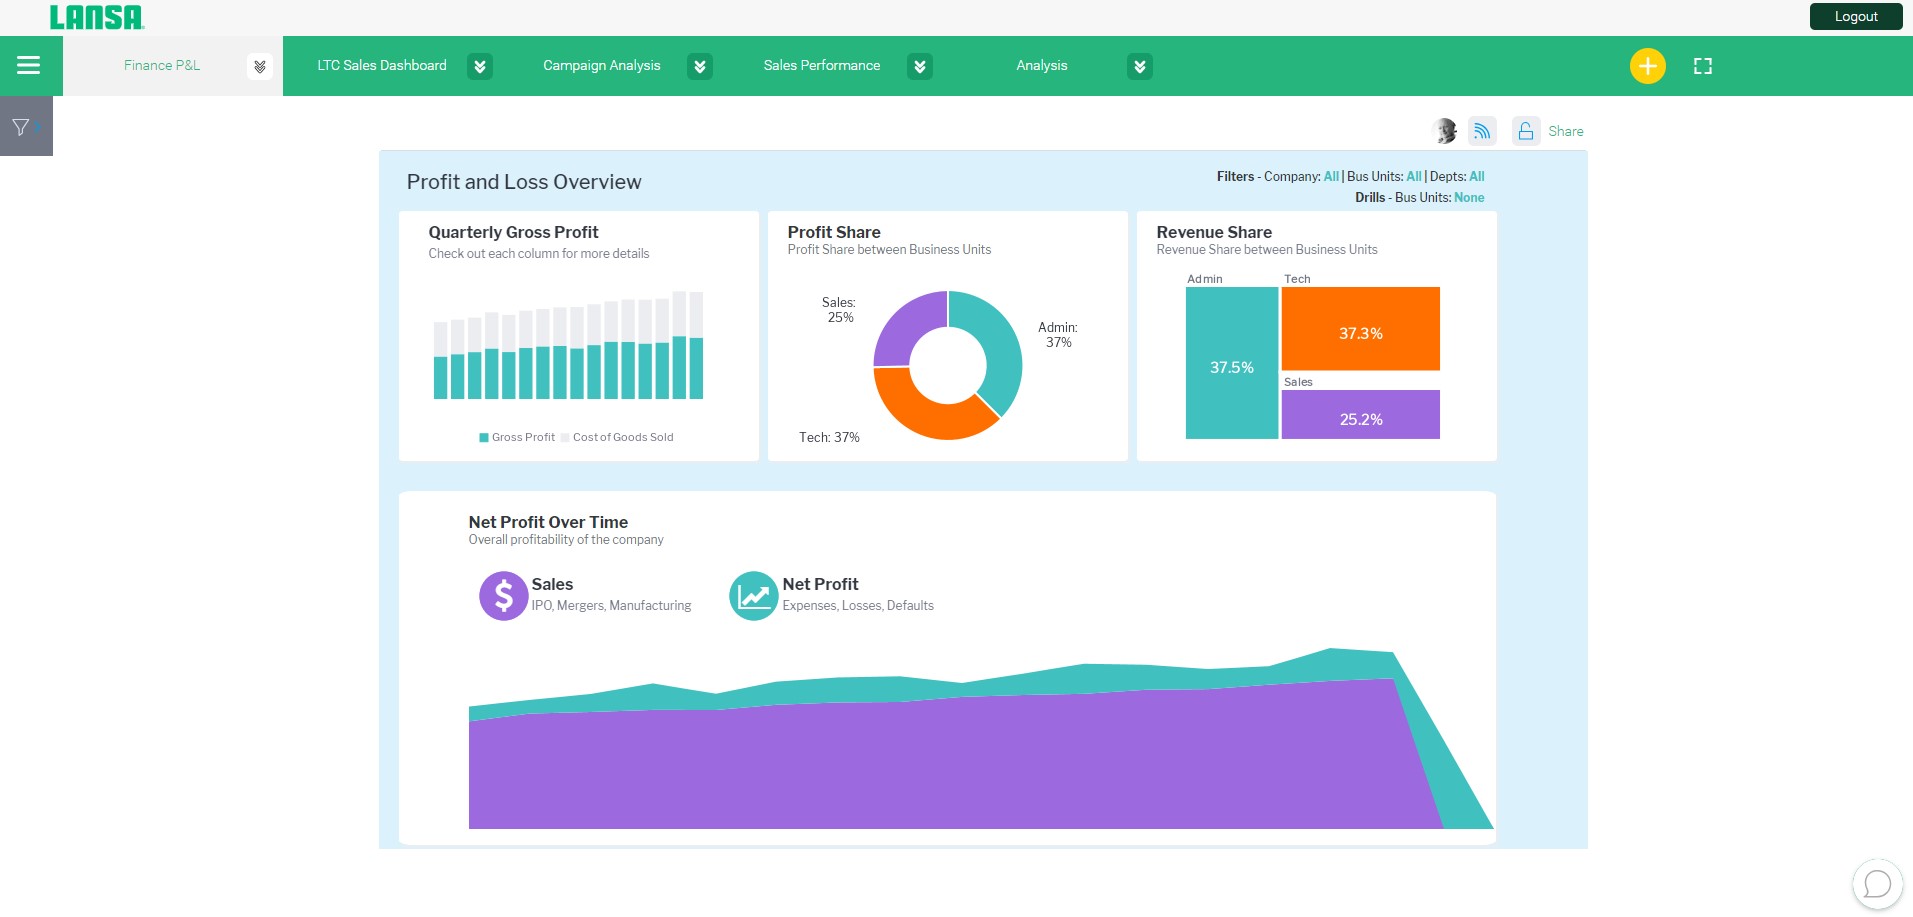
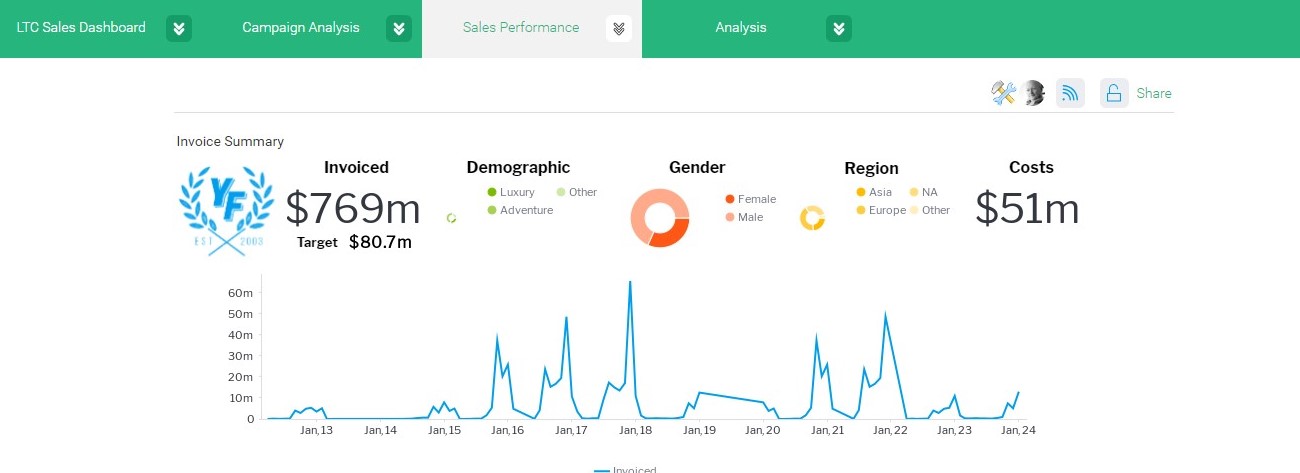
BI Dashboards
A Bi dashboard serve as centralized hub for displaying key metrics and insights in real time. These dashboards provide a customizable interface where users can select specific metrics and visualizations that align with their reporting needs. By consolidating relevant data into a single view, BI dashboards facilitate quick and comprehensive analysis, allowing users to monitor performance and identify areas requiring attention.
Self-Service BI
Self-service BI tools empower business users to independently explore and analyze data without relying on data analysts or IT professionals. These tools often feature user-friendly interfaces, drag-and-drop functionality, and predefined data models. Self-service BI enables non-technical users to access and visualize data, create ad hoc reports, and gain insights on their own. This promotes agility and empowers users to make data-driven decisions in real time.
Data Stories
Data stories combine the power of data visualization with narrative storytelling techniques. They go beyond presenting raw data and provide context, explanations, and interpretations that guide readers through the data and its implications. Data stories connect data points to real-world scenarios, adding a human element to the analysis. By presenting data in a compelling and relatable manner, data stories enhance understanding and engagement, making insights more memorable and actionable.
In BI reporting, these components work together to transform raw data into meaningful insights. Data visualization techniques enable the effective communication of complex information, while BI dashboards and self-service BI tools provide user-friendly interfaces for accessing and analyzing data. Data stories add context and narrative making the insights more relatable and actionable for stakeholders.
Types of Business Intelligence Reporting
Business intelligence reporting encompasses various types and approaches to cater to different business needs. Here are three common types of business reporting:
Performance Management BI Reporting
Performance management BI reporting focuses on tracking and evaluating Key Performance Indicators (KPIs). It provides insights into areas like sales performance, financial metrics, operational efficiency, and customer satisfaction.
Predictive Analytics BI Reporting
Predictive analytics adopts a forward-looking approach using statistical algorithms and machine learning techniques to analyze historical data. It gives you the power to anticipate customer behavior, market shifts, and operational requirements.
Augmented Analytics BI Reporting
Augmented analytics BI reporting merges AI and machine learning with traditional reporting to automate data preparation, data modeling, and insights generation. This helps you to gain insights into your data quickly without requiring technical expertise.
Business Intelligence Reporting Benefits
Unlocking the full potential of business intelligence reporting brings many benefits that extend across various parts of your organization. Here are some of the key benefits:
Enhanced Decision Making
BI reports equip decision-makers with timely, accurate, and relevant insights that empower them to make informed decisions that align with business goals and drive success. In an independent study by Tableau, businesses using BI showed a 127% ROI.[1]
Improved Operational Efficiency
Business intelligence reporting provides a comprehensive view of your organization’s processes and can identify bottlenecks, inefficiencies, and opportunities for optimization.
Deeper Customer Insights
Your business intelligence reports will enable you to analyze customer data comprehensively, leading to better customer segmentation, personalized marketing campaigns, and improved customer experiences.
Enhanced Performance Monitoring
Real-time dashboards and automated alerts enable organizations to monitor performance continuously and rapidly respond to deviations from targets or unexpected issues.
Competitive Advantage
BI reporting allows for trend analysis, competitive benchmarking, and identifying emerging opportunities, which can provide a competitive edge by allowing your organization to adapt to market changes quickly.
Selecting the Right BI Tool
Choosing the right business intelligence reporting tool is important to get the most value out of your data. Here are some important capabilities to consider when selecting a BI reporting tool:
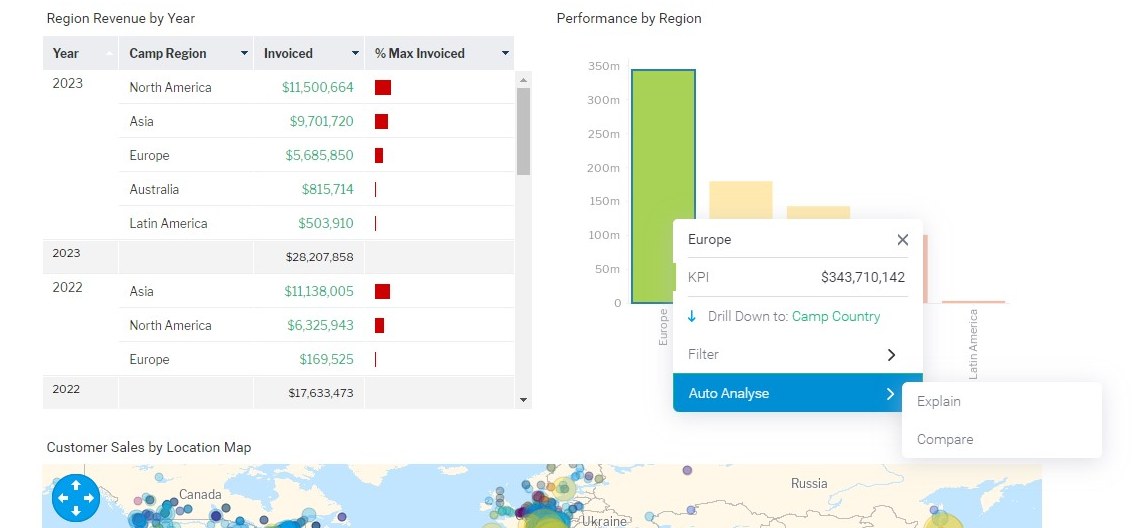
Augmented Analytics
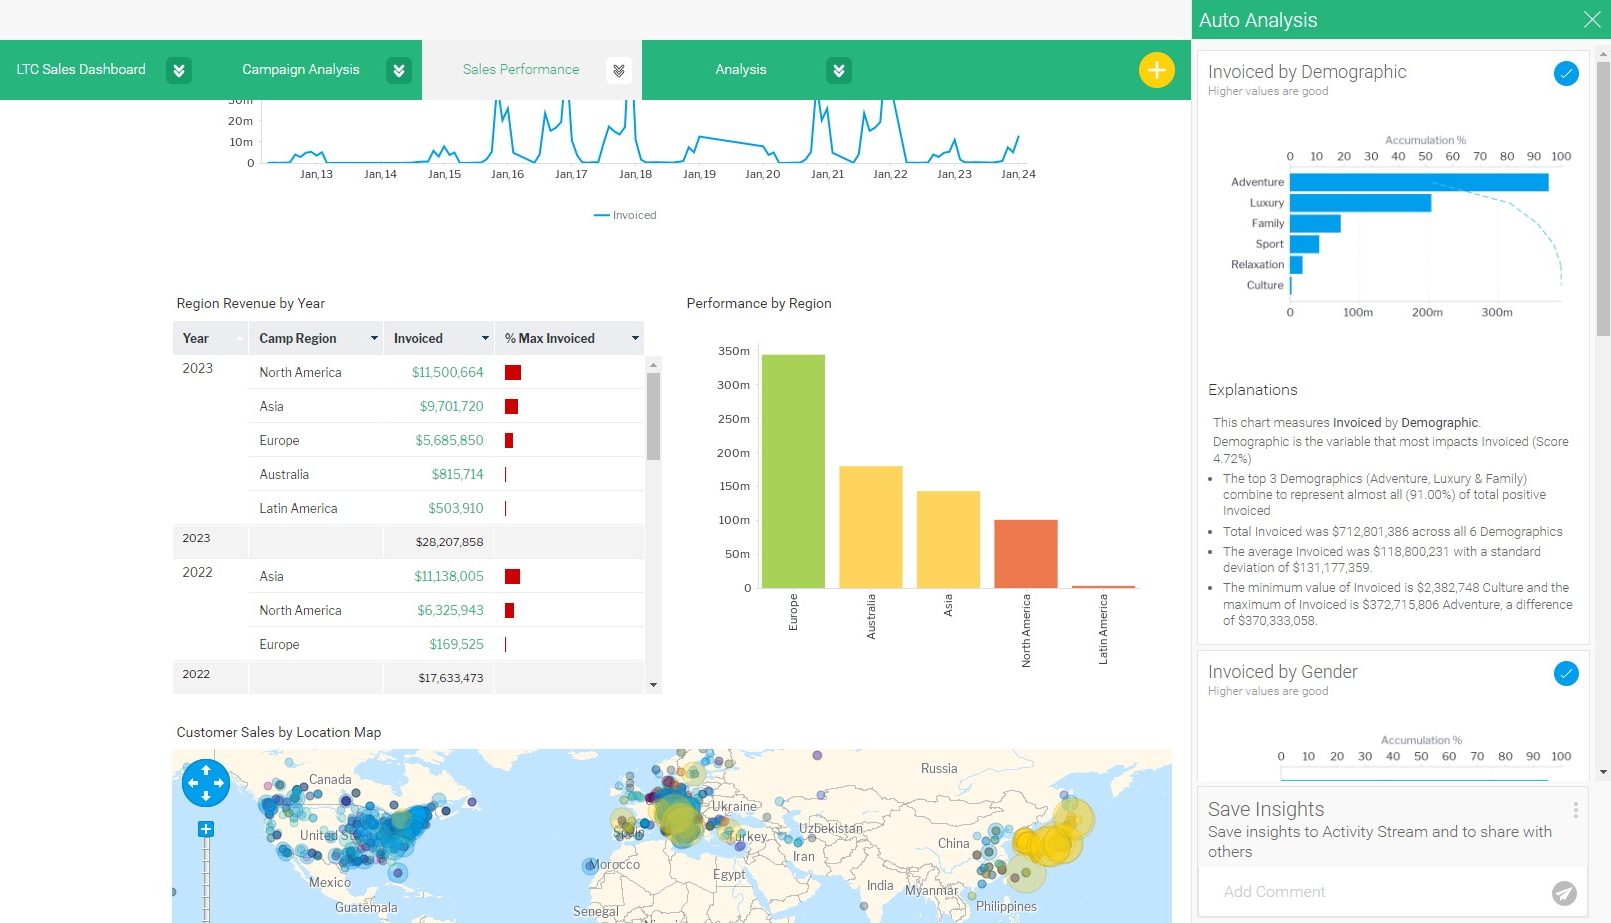
Look for BI software that integrates AI and machine learning to enhance data analysis. It should be able to automatically discover insights, suggest visualizations, and assist users in generating reports, making it accessible to a broader range of users. LANSA BI‘s assisted insights use AI to help find new insights hidden in your data, explain and compare data points, and automatically alert you of significant anomalies or trend shifts.
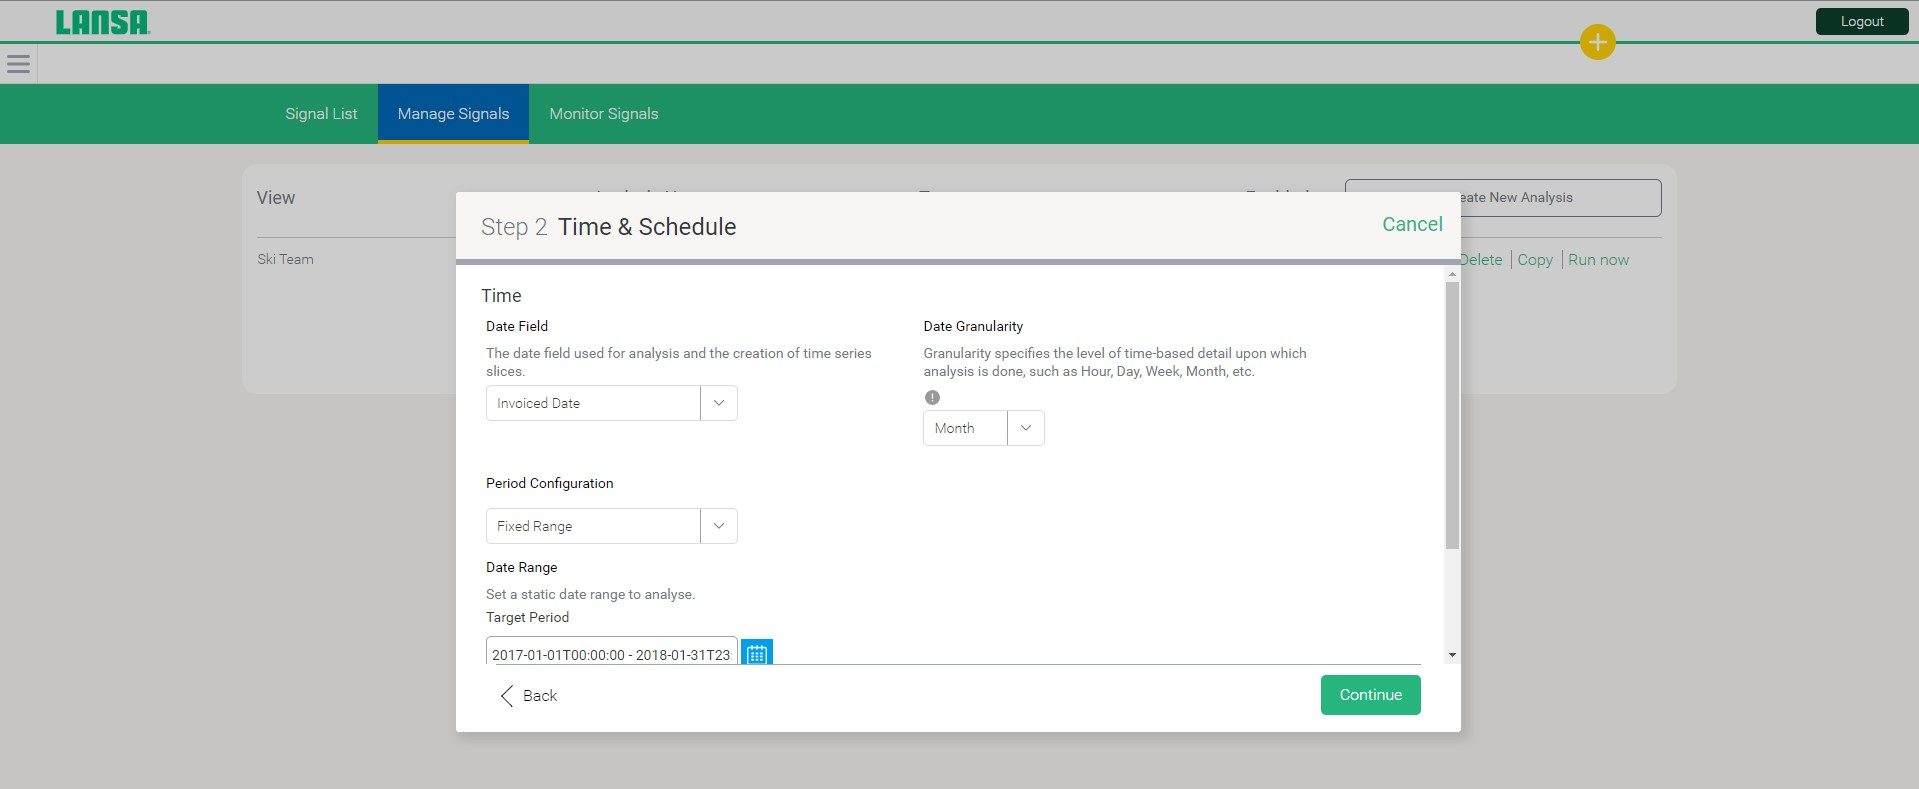
Automated Business Monitoring
This feature will allow you to set up notifications that trigger when conditions are met. It enables proactive monitoring of metrics like sales performance, inventory levels, or customer satisfaction and gives decision-makers the ability to respond quickly to critical events.
Contextual Analytics
This capability provides deeper insights by incorporating contextual information, like market trends, social media data, or economic data, into data analysis. This enables leaders to understand the broader context surrounding their data and make better decisions.
Data Storytelling
This BI feature allows users to combine data visualizations with annotations, explanations, and interpretations to create engaging narratives that guide readers through the data. This capability makes it easier for stakeholders to understand the insights the data provides.
Learn more about the power of data storytelling by watching this webinar.
Embedded BI (Analytics)
Embedded Analytics is an essential feature of your BI tool if you want to integrate BI reporting into your existing applications and workflows. It allows you to embed reports and dashboards directly into other software, such as CRM systems or custom web applications. LANSA BI does this for IBM i applications and allows you to build actionable BI reports through native DB2 integration.
Learn more about Modern BI for Db2 Web Query Users and First-Time Adopters .
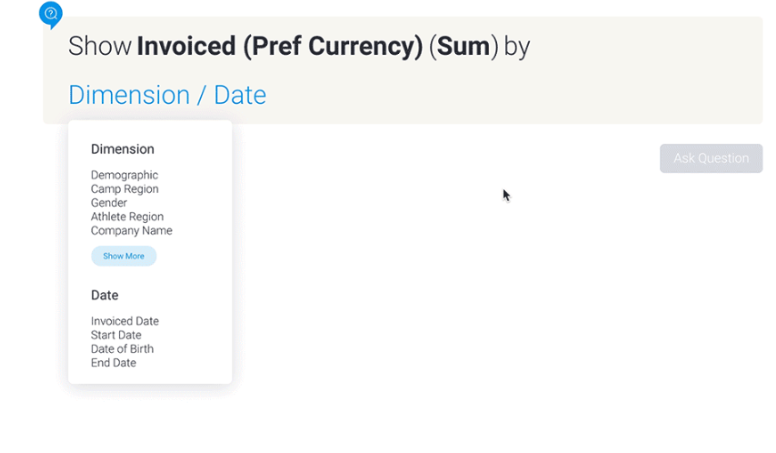
Natural Language Query
This BI tool capability allows you to interact with data using everyday language rather than complex query languages. Natural Query Language (NLQ) is an important feature of LANSA BI that empowers non-technical users to ask questions and receive immediate answers about their data without needing help from analysts or developers.
BI Reporting Best Practices
Efficient BI reporting is not just about having the right tools; it’s also about adopting best practices that ensure your reports deliver insights that mean something. Here are some best practices to consider:
Clarify Requirements
The first step is understanding your reporting requirements. Define the goals, objectives, and questions you want to address with your reports. This will help you focus on gathering the right data and designing reports that provide insights aligned with your business needs.
Identify Your Audience and Their Needs
Different stakeholders require different levels of detail and specific insights. Consider who will use your BI reports, what information is most critical to them, and how they prefer to consume it.
Prepare Your Data
Before creating business intelligence reports, clean and prepare your data to make sure it is accurate and consistent. Address missing values, remove duplicates, and verify data integrity. Properly prepared data will enhance the reliability of your reports. According to Gartner, poor data quality costs businesses an average of $12.9 million a year.[2]
Choose the Right Metrics
When choosing metrics, focus on key performance indicators (KPIs) that directly align with your business objectives. Avoid data overload by including only the most relevant metrics. A concise set of metrics will better highlight the important aspects of your business performance.
Accentuate the Most Important Information
Prioritize critical information by highlighting it prominently in your reports. Use visual cues like colors, icons, or callouts to draw attention to the most important insights. Make it easy for readers to quickly understand the most important findings.
Use the Right Visualizations for Your Data
Bar charts, line graphs, pie charts, and heatmaps all have their place, depending on the type of data and the message you want to convey. The visualizations you choose should enhance comprehension, not obscure it.
Provide Context
Contextualize your data by including relevant background information and explanations. Define terms, offer historical context, and provide insight into the implications of the data. This will help readers interpret the data accurately.
Add Interactivity
Make your reports interactive by allowing users to explore the data. Incorporate drill-down capabilities, filters, and interactive elements that allow users to investigate specific data points and customize their views to their needs.
Iterate and Evolve
BI reporting shouldn’t be static. Continuously update your reports based on feedback and changing business requirements. Regularly reassess the effectiveness of your BI reporting and make adjustments as needed to ensure they stay relevant and valuable.
Tips for Crafting Compelling BI Reports
BI reports play an important role in communicating insights and assisting decision-making within organizations. Here are some tips to help you ensure that when you report business intelligence, you also tell a meaningful story:
Structure Your BI Reports
Organize the report in a logical sequence that guides users through the information. Typically, start with an executive summary or key findings, followed by details and supporting data. Use clear and descriptive headings and subheadings to divide the report into sections. This makes it easier for users to navigate and locate specific information.
Build a Narrative
Craft a narrative that guides readers through the insights. Start with a clear problem or question, introduce the data, highlight key findings, and conclude with actionable recommendations.
Use Visualizations for Impact
Ensure that visualizations are uncluttered and labeled correctly. Use color to emphasize important points. Also, make sure to choose the right visualizations for your data, like bar charts for comparisons, line graphs for trends, and pie charts for proportions.
Turn Data into Stories
Explain the context behind each chart or graph. What story does it tell? What insights can be drawn? Use annotations or captions to guide readers through the visuals, highlighting important points.
Add Actionable Recommendations
Clearly outline what steps the organization should take based on the data presented. Ensure that your recommendations are specific, achievable, and aligned with the objectives of the report.
Set Key Performance Indicators (KPIs)
Define KPIs that align with your report’s goals and track them over time. Are your reports driving positive changes in the organization? Use KPIs to gauge the effectiveness of your reporting and make changes as needed.
Industries that Benefit from BI Reporting
Business intelligence reporting is a flexible tool that can be used across a variety of industries. Here are just some of the industries that can take advantage of BI reporting:
Retail Industry
BI reporting helps retailers optimize inventory management, track sales trends, and improve customer experience. It makes dynamic pricing strategies, personalized marketing campaigns, and real-time monitoring of store performance possible.
Telecommunications Industry
BI reports help telecommunication companies track network performance, detect anomalies, and proactively address service issues. They also assist in analyzing customer behavior, improving retention strategies, and identifying opportunities for revenue growth.
Financial Industry
In the financial sector, BI reporting is instrumental in risk assessment, fraud detection, and compliance monitoring. It gives financial institutions the ability to analyze market trends, make informed investment decisions, and optimize portfolio management. Banking accounts for 13.9% of total revenue for the BI market.[3]
Transform Data Experiences with BI Reporting
In this guide, we’ve examined the process of reporting business intelligence and the important part it plays in informed decision-making. As we wrap it up, let’s review some of the key insights:
- BI reporting is the linchpin of data-driven decision-making.
- Learning the mechanics of BI reporting will help you unlock its full potential.
- Explore the types of BI to find those that fit your organization’s needs.
- Consider the features of the business intelligence tool before deciding on one.
- Adhere to best practices in order to get the most out of your business intelligence reporting.
Data is your strategic ally, guiding you toward a future marked by informed decisions, growth, and prosperity, and business intelligence is the tool that helps you get there. LANSA BI can help you build actionable insights through native DB2 integration. To find out how to democratize data and intelligence with embedded analytics for IBM i (AS/400) applications, contact us today.
References
[1] https://www.tableau.com/forrester-roi-report-info-mgmt-1A
[2] https://www.gartner.com/smarterwithgartner/how-to-improve-your-data-quality
[3] https://yourstory.com/mystory/business-intelligence-applications-technology-industry