Similar to the dashboard in your vehicle, a business intelligence dashboard centralizes important information so you can access it at a glance. This makes it an important facet of data-based decision-making in a range of industries. With a customizable dashboard, you can set up an instant insight-generation tool that can streamline decisions, presentations, and important conversations with other strategists.
This article provides you with a comprehensive understanding of what a business intelligence dashboards is, the features that make it so valuable, its benefits and best practices for maximizing its value.
Key Insights:
- A business intelligence dashboard plays a central role in decision-making because it gives you real-time data from a range of apps or business processes.
- BI Dashboards facilitate the simplification of your business data because they enable you to choose which data points you want to feature instead of displaying unnecessary or distracting information.
- While creating a business dashboard can be complicated, using an IBM i BI solution like LANSA BI makes it simpler because you can drag and drop the data you want to include.
What is a Business Intelligence Dashboard?
A business intelligence dashboard refers to data visualization tool businesses and analysts use to manage information and make decisions. BI dashboards often feature graphs, charts, and reports that give you a quick look at business-critical data [1].
They play a vital role in data-based decision-making because they enable you to position the most important information front and center, giving you all you need to know about a certain element of your business in a few moments. Also, because business intelligence dashboards incorporate real-time insights from different areas of your business, you can make decisions based on a wider range of up-to-date information.
Business Intelligence Dashboards vs. Business Intelligence Reports
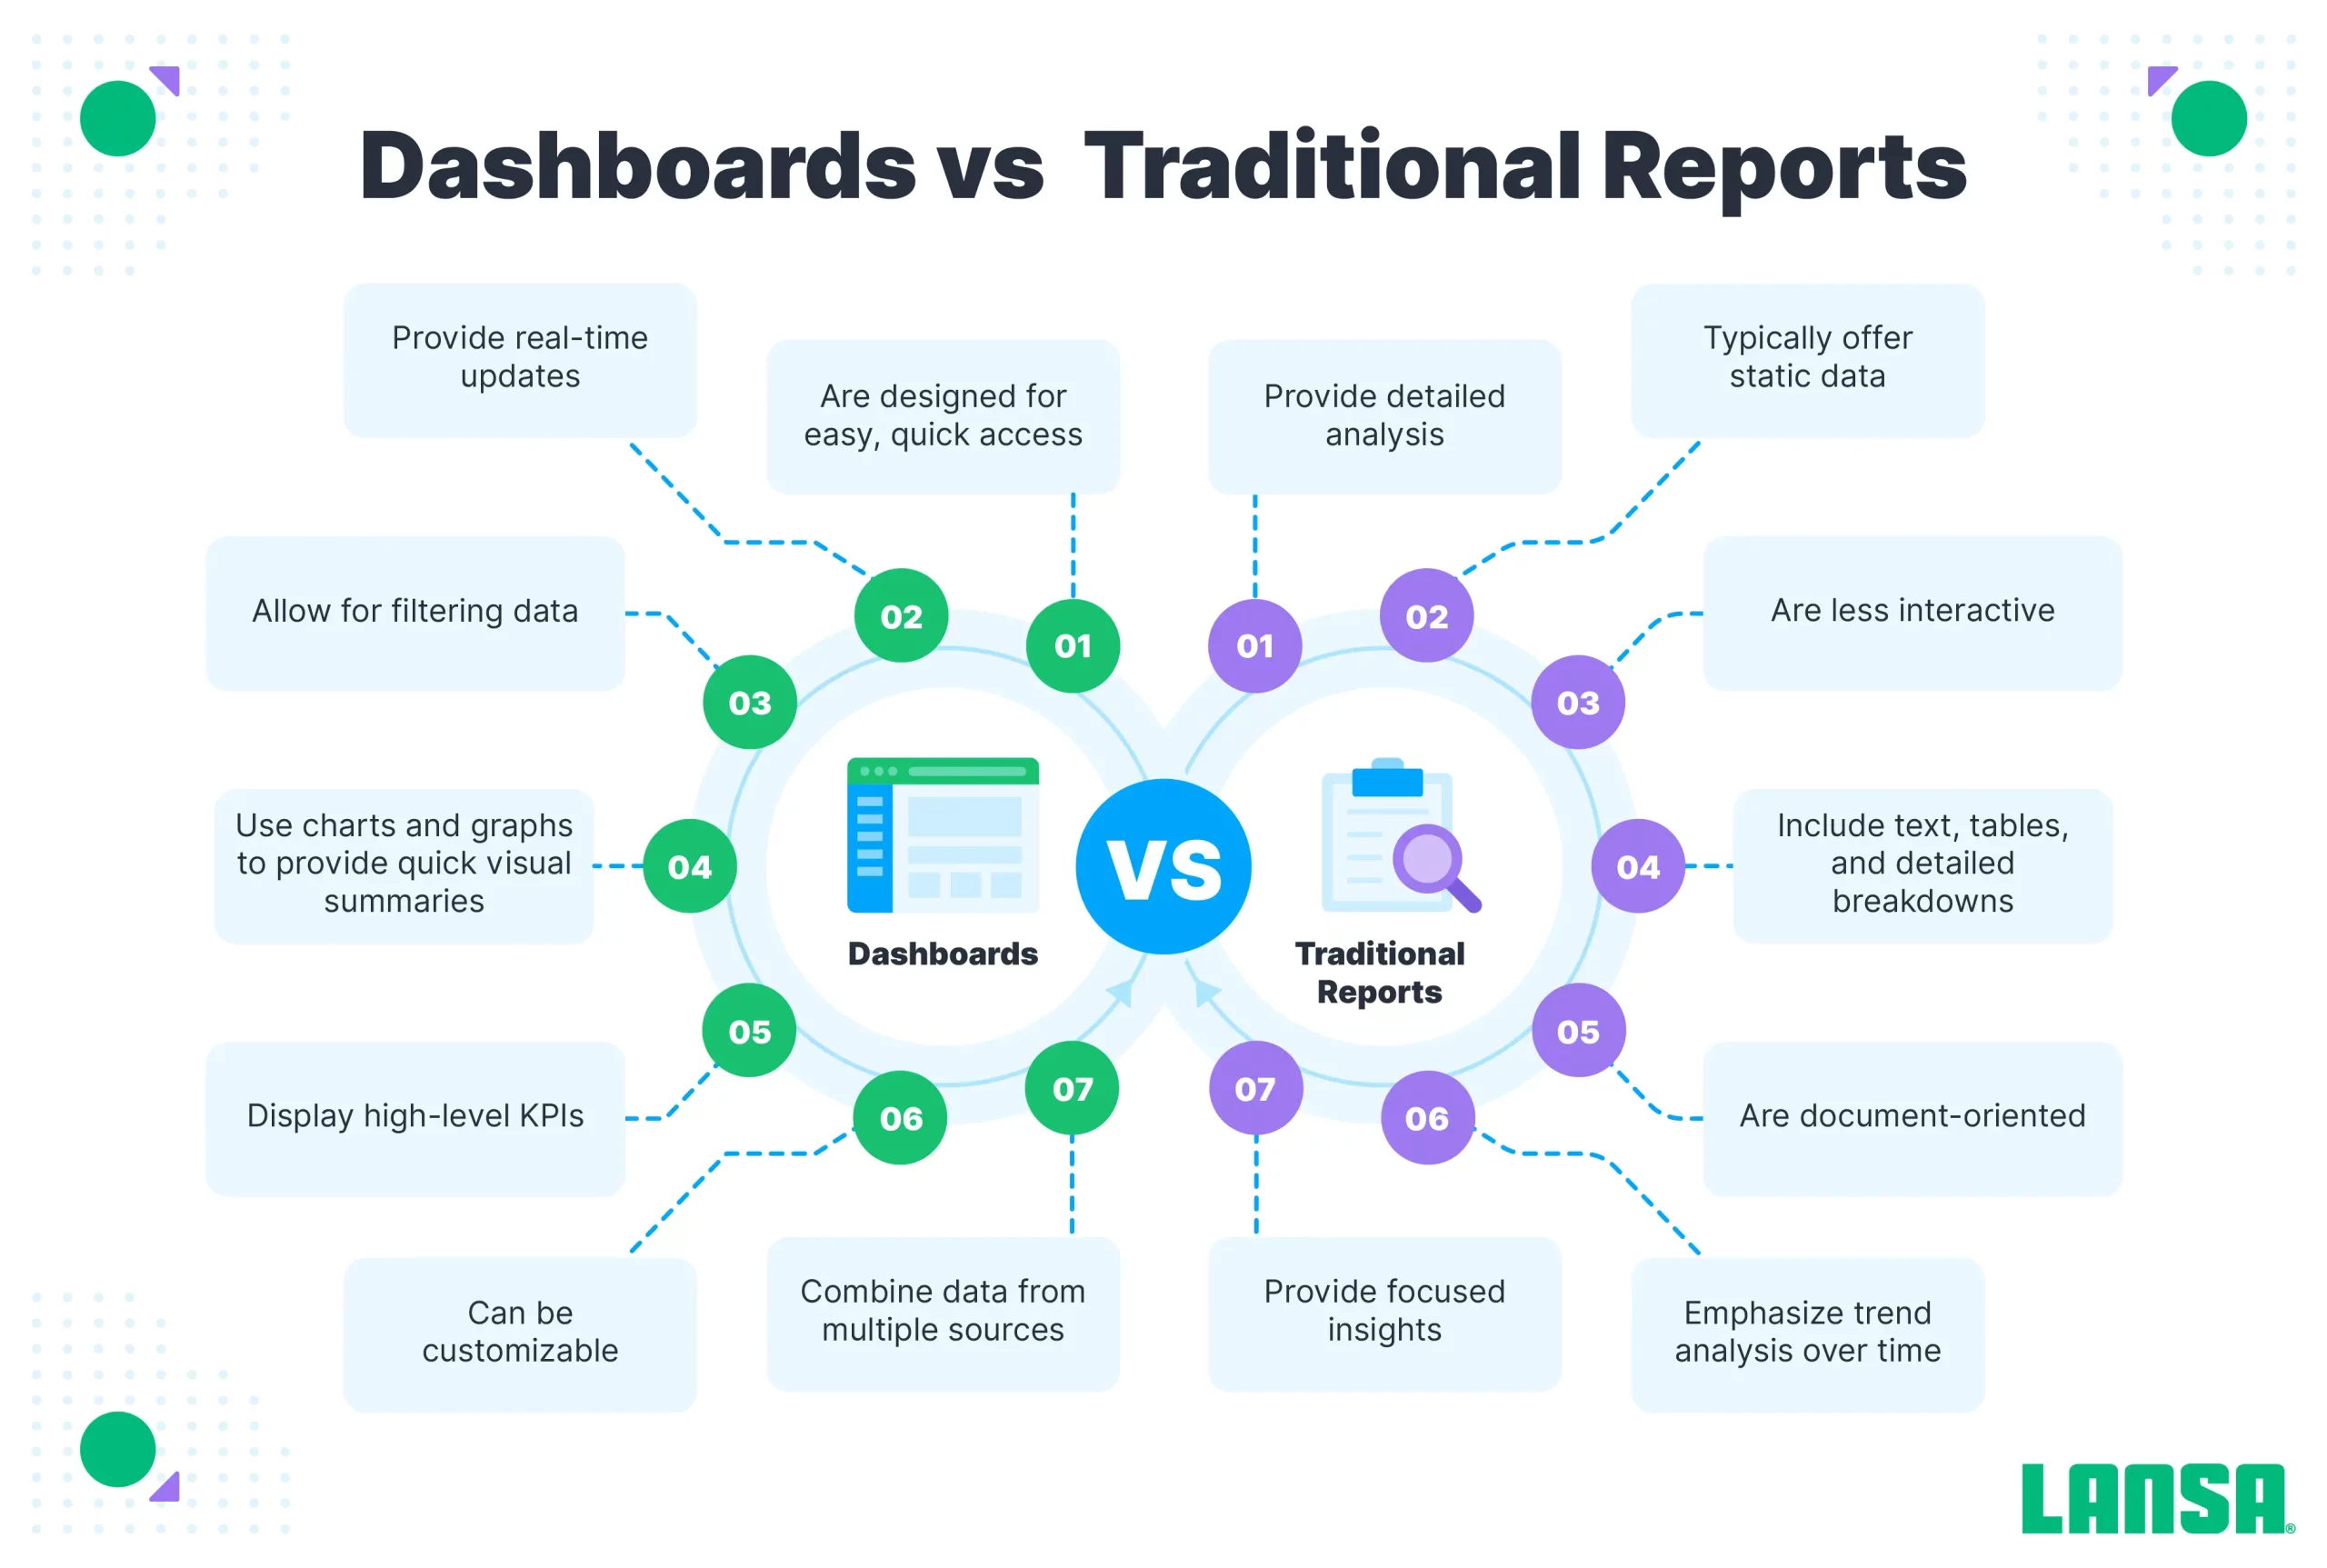
Both dashboards and BI reporting are important in business intelligence, but they are different and play unique roles. Reports provide information about one or multiple elements of your business, while a dashboard typically consists of multiple reports, which may be in chart, graph, or written form.
A report often provides a deeper dive into the details of an element of your business, making it valuable for stakeholders who need a more intimate understanding of a business situation. Dashboards give you a higher-level overview of multiple business data points.
Understanding Business Intelligence Dashboards
Business intelligence dashboard software is a powerful tool for generating and leveraging data-driven insights. Because it gives you a comprehensive view into several aspects of your operations, you can make well-informed decisions that take into account what’s happening in multiple elements of your operations.
Purpose of a Business Intelligence Dashboard
A business intelligence dashboard is a visual tool that consolidates and presents key business data in a user-friendly format [2]. As such, it enables:
- Quick insights
- Real-time performance monitoring
- Strategic decision-making
- More effective data analysis
- Cost-saving and efficiency improvements
Features and Components of Business Intelligence Dashboards
Some of the most essential features of BI dashboards include:
- Data visualization. They provide you with charts and graphs that present data in the context of time, location, and other data points you want to weave in.
- Interactive charts. With the interactive charts in a business dashboard, you can hover, click on, and expand each display to get more information or take a closer look.
- Widgets. Widgets, in the context of business dashboards, refer to pre-made functions that save you time as you create each module in the design of your analytical solution. Widgets are especially useful when building an embedded analytics solution.
- Filters. You can use filters to remove data that you may not need and focus on information that can help you make a better decision. For instance, you can see data based on the state in which different customers live or the time orders were shipped.
Dashboard business intelligence hinges on using:
- Metrics, which quantify outputs and progress toward goals using objective measurements
- KPIs, or key performance indicators, which make it easier to gauge how well different business units, people, or processes are meeting your objectives
- Drill-down capabilities, which give you the ability to hone in on the data powering your results, getting into more granular details for deeper analysis
- Data Integration, which enables you to unite data from across your organization. This facilitates the analysis of how different business functions impact each other and the success of your operations.
LANSA BI: Empowering BI Dashboard Creation
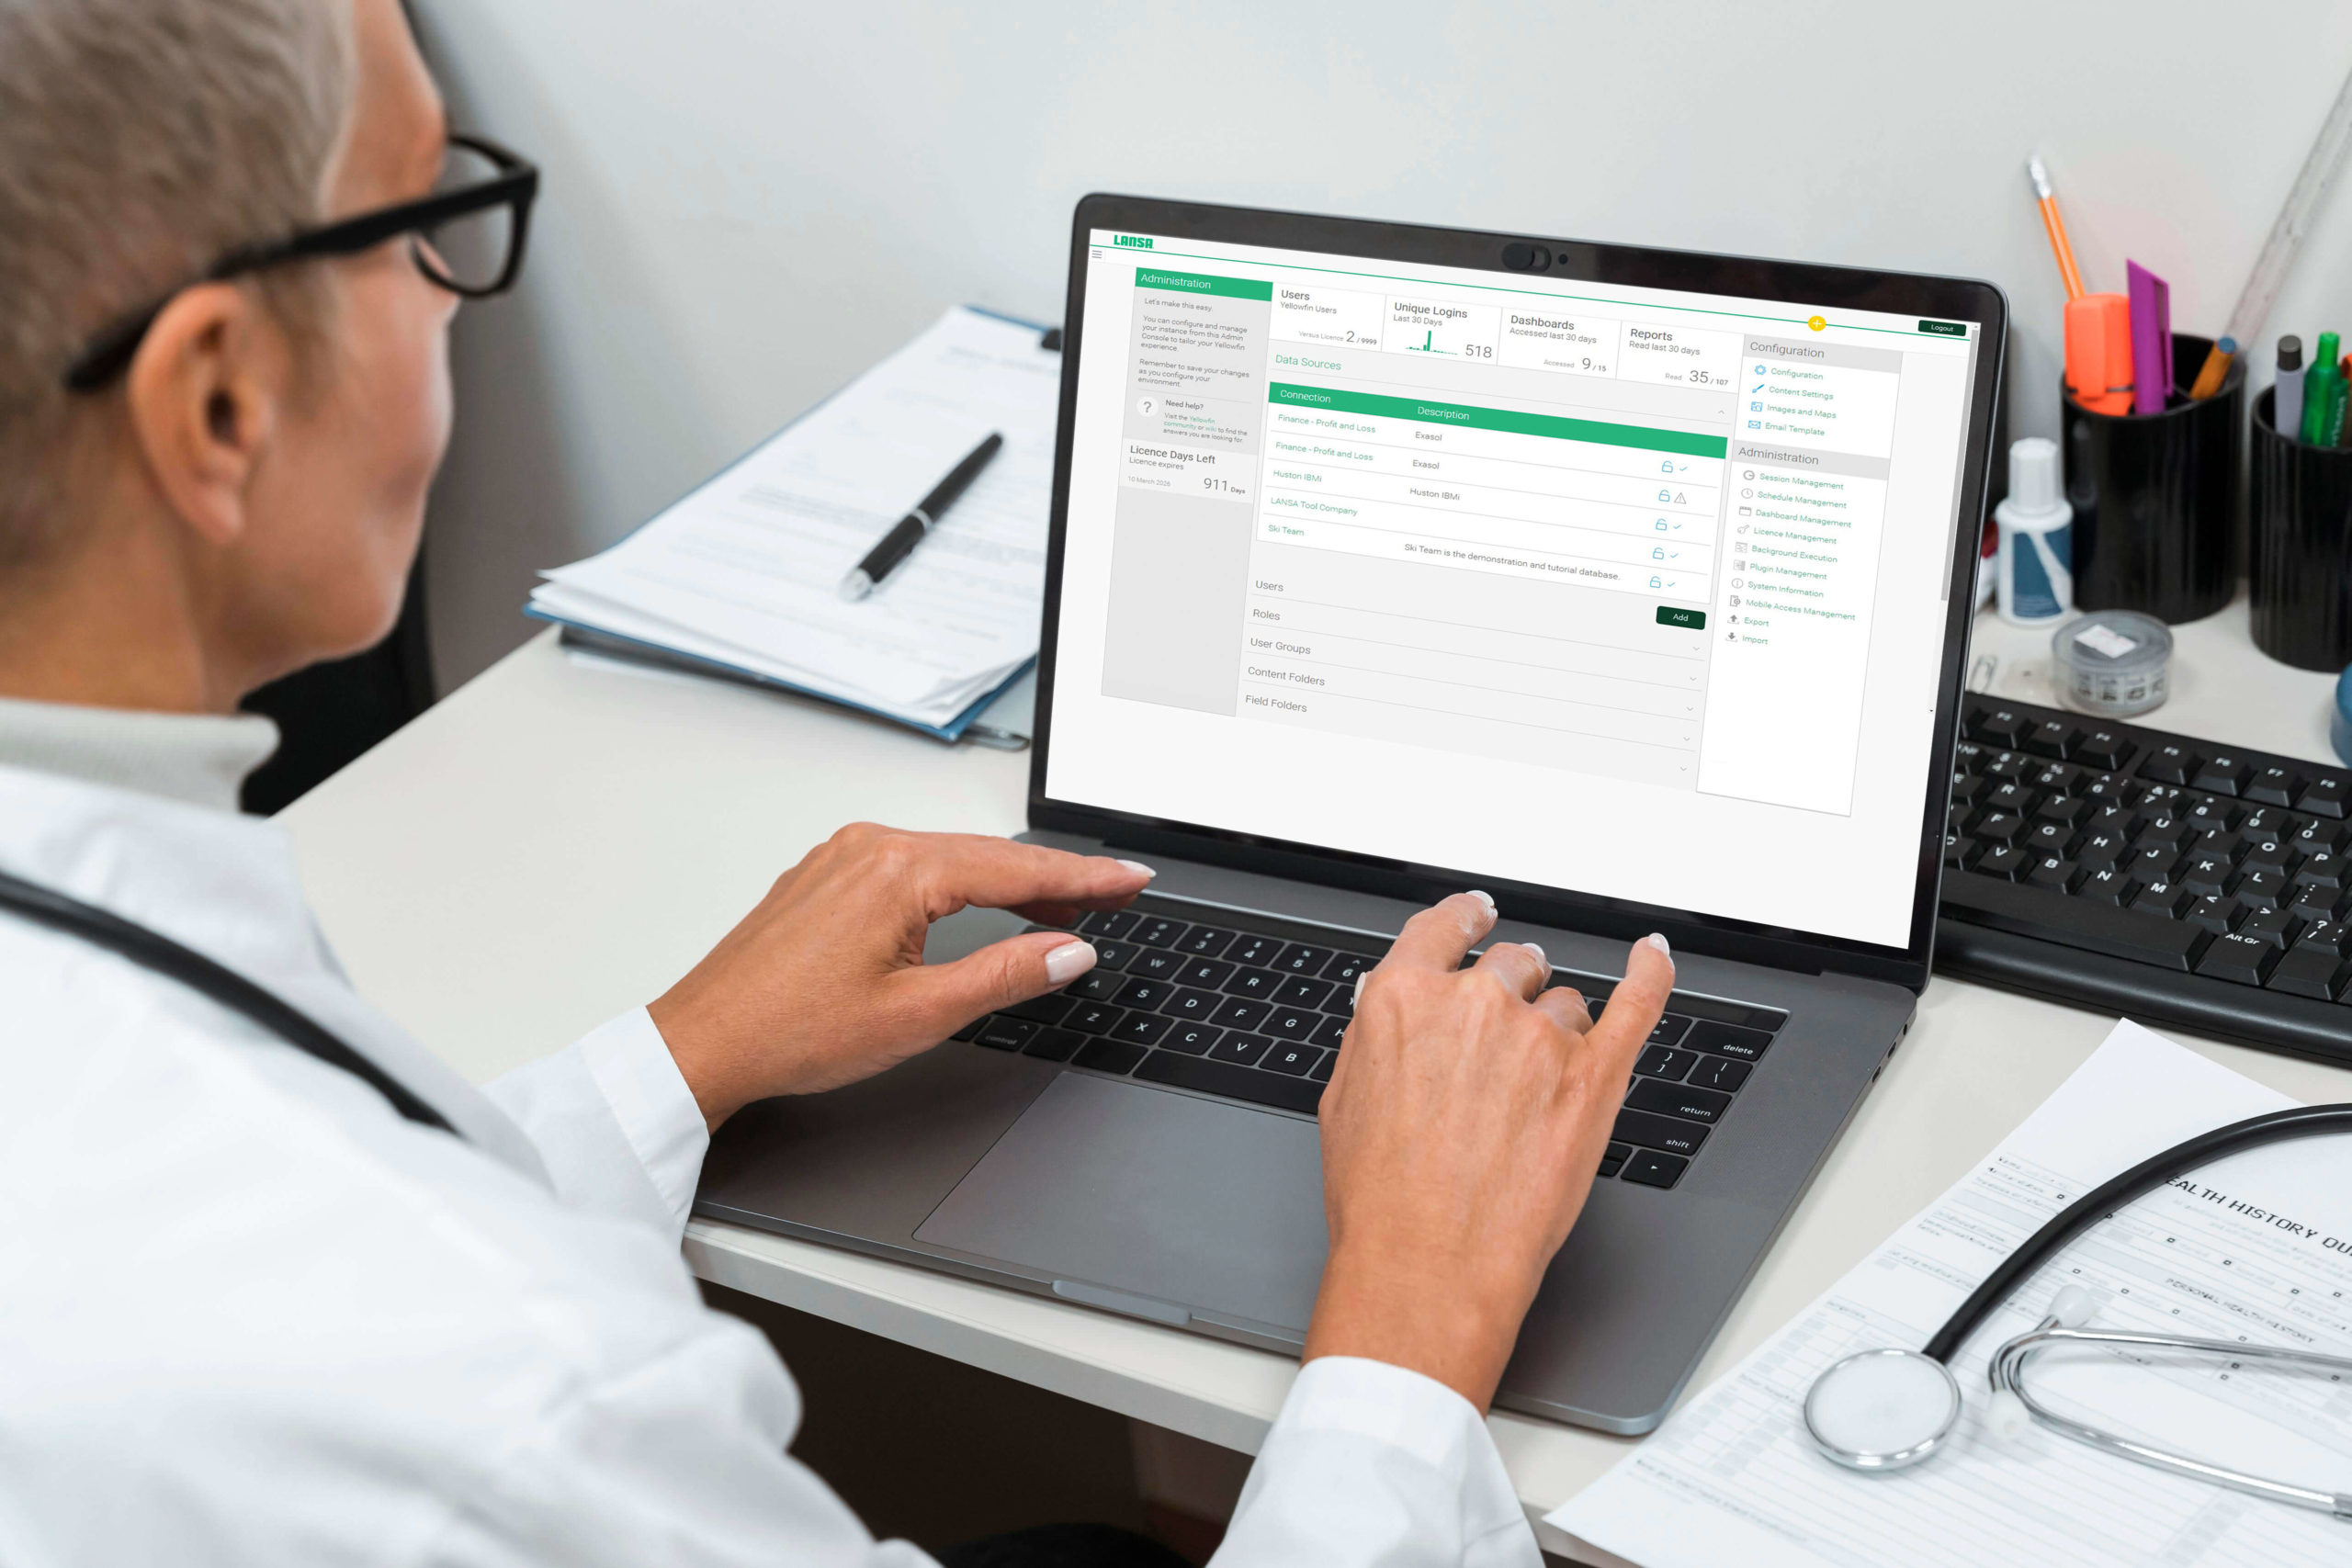
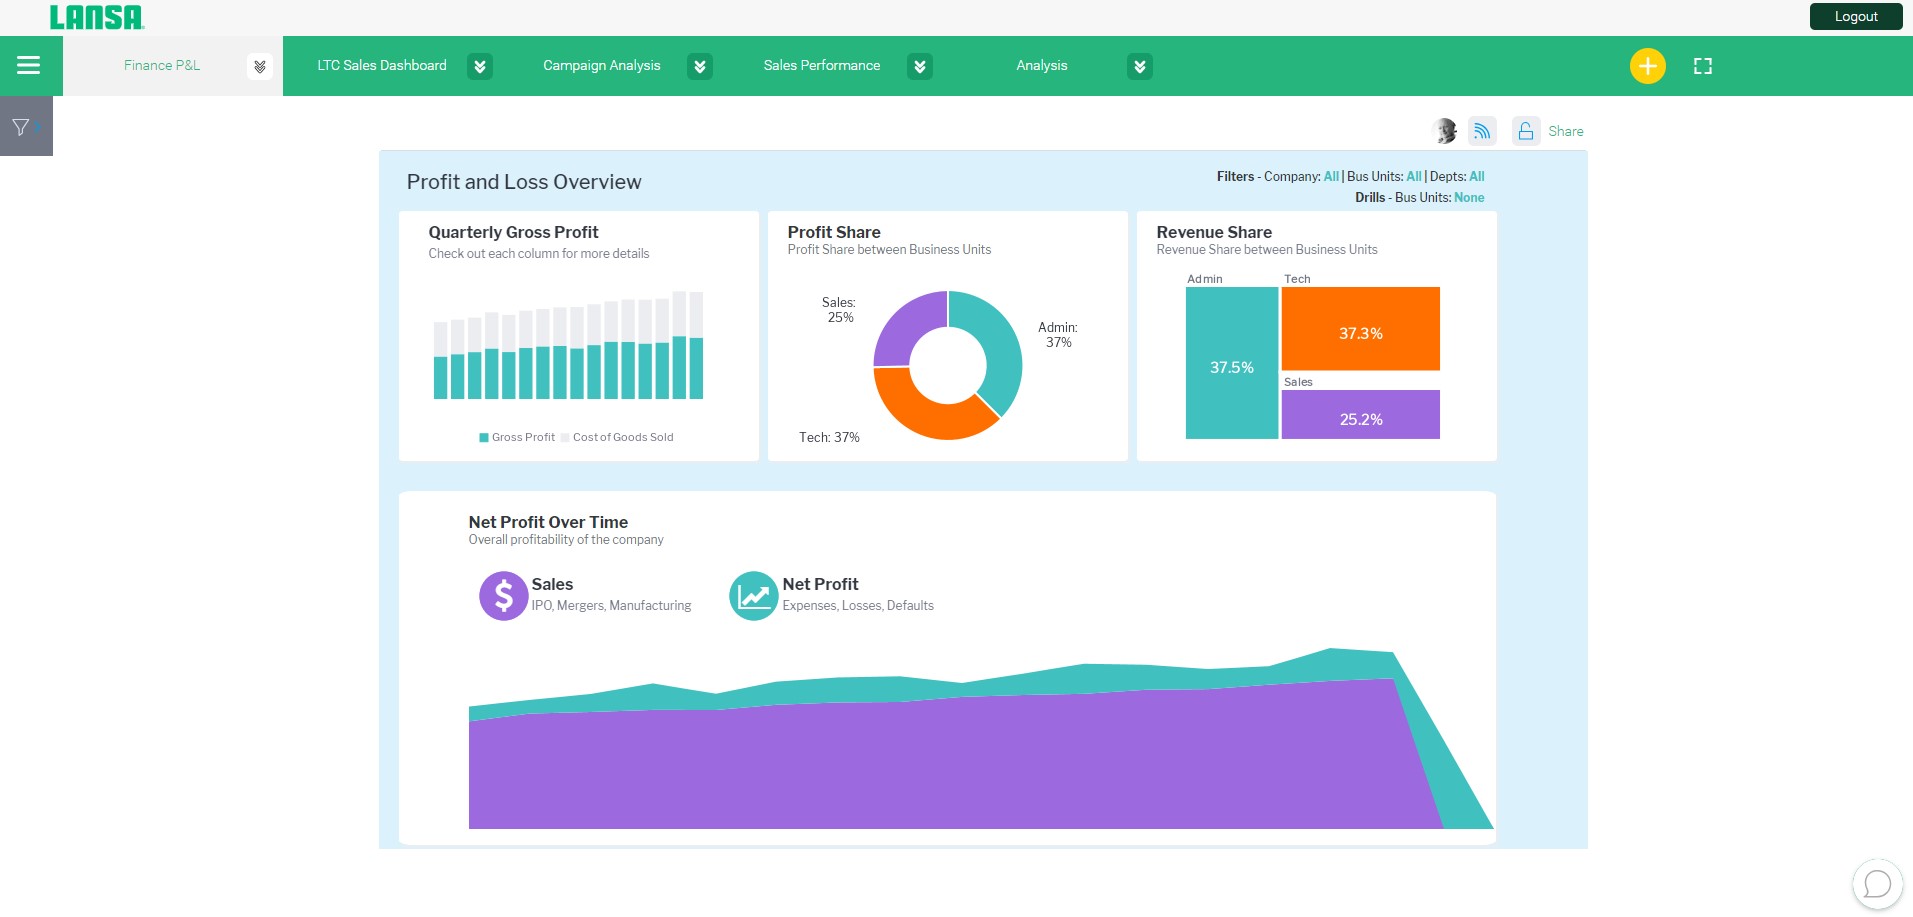
LANSA BI is a powerful IBM i business intelligence tool. It is a multi-faceted, easy-to-use, robust tool for building customizable and dynamic BI dashboards. With LANSA BI, you can create dashboards in a matter of minutes because you simply click on the data points you want to analyze to incorporate them into your dashboard.
LANSA BI allows you to drag and drop data points into the horizontal and vertical axes of a graph. You can then choose the type of chart you want, adjust colors, apply filters, and more to make it relevant to your analytical process.
Business Intelligence Dashboard Benefits
Business intelligence dashboards streamline the decision process for a wide variety of stakeholders, especially because they can be customized according to individual needs.
Data-Driven Decision Making
With business intelligence dashboards, you get real-time or near-time insights. Using this up-to-date information, you can make better decisions based on the latest data. This makes it easier to identify trends that could indicate trouble down the road or a potential opportunity.
Real-time data also enables pattern and correlation recognition, giving you insight into how data points intersect and impact each other.
Enhanced Performance Monitoring
Business intelligence dashboards enable you to monitor key metrics and KPIs because you can see reports that cover several important data points at a glance. This enables proactiveness, performance management, and goal tracking because you have relevant, accurate data at your disposal.
For example, you may look at your business intelligence dashboard and notice that sales at a retail location are slumping in the wake of a snowstorm. By getting a truck to plow the parking lot, you can save thousands of lost revenue. Your BI system enables these kinds of time-sensitive insights, saving funds and unearthing ways of improving or supporting operations in real time.
Improved Data Analysis
A BI dashboard simplifies complex data analysis because it give you a clear visualization of your information. Instead of spending precious minutes trying to comb through lists of numbers and make sense of them, you can invest your time in designing and implementing strategies. In fact, it can make the decision-making process up to five times faster [3].
In addition, you can slice and dice data, apply filters, and perform ad hoc analysis for deeper insights. These capabilities enable closer inspection of data so you can answer questions regarding the results you’ve observed and discover individual data points that may add important details to your narrative.
Simple, Self-service Business Intelligence Applications
With a simple BI app, you can give many different people on your team the ability to deliver business intelligence (also known as self-service BI), regardless of whether they have deep technical expertise. This empowers your team members, giving them the ability to analyze different operational factors and adjust their decisions accordingly.
Accurate Forecasting
It’s easier to strategize your next move when you have an idea of what’s on the horizon, and a business intelligence dashboard can streamline your forecasting process so you know how to prepare. Because your dashboard features visualizations of your data, you can identify trends in a matter of moments and then make decisions using these insights.
Business Intelligence Dashboard Limitations
Depending on how you use it, a BI dashboard can also be problematic because:
- Flashy or busy BI dashboard designs can be difficult to use.
- When you have too much visual information because too much raw data has been incorporated, it can be confusing.
- The dashboard may not provide adequate context in relation to how you’re measuring up to your KPIs. A chart or graph only contains part of the picture.
- With some dashboards, it can be difficult to drill down to see the underlying data behind the metrics.
- Unless you’re working with high-quality, clean, accurate data, the dashboard may provide misleading analyses.
Business Intelligence Dashboard Implementation
Implementing a BI dashboard system involves preparing and integrating the data that you’ll use to analyze.
Data Integration and Preparation
You need high-quality, consistent data to ensure your dashboard business intelligence provides accurate insights that drive effective decision-making [4]. For example, your data could be corrupted by outliers that skew averages in one direction or another, resulting in a misleading chart. Data can also be cluttered with duplicates or inaccuracies. It’s important to clean data before using data integration to build your BI dashboard.
You may also have to transform your data beforehand by normalizing, smoothing, or standardizing it to produce more useful results in your dashboard. Data aggregation, which may involve combining, grouping, or summarizing data, may also be important because it can make your dashboard’s ultimate analysis clearer.
Designing Effective BI Dashboards
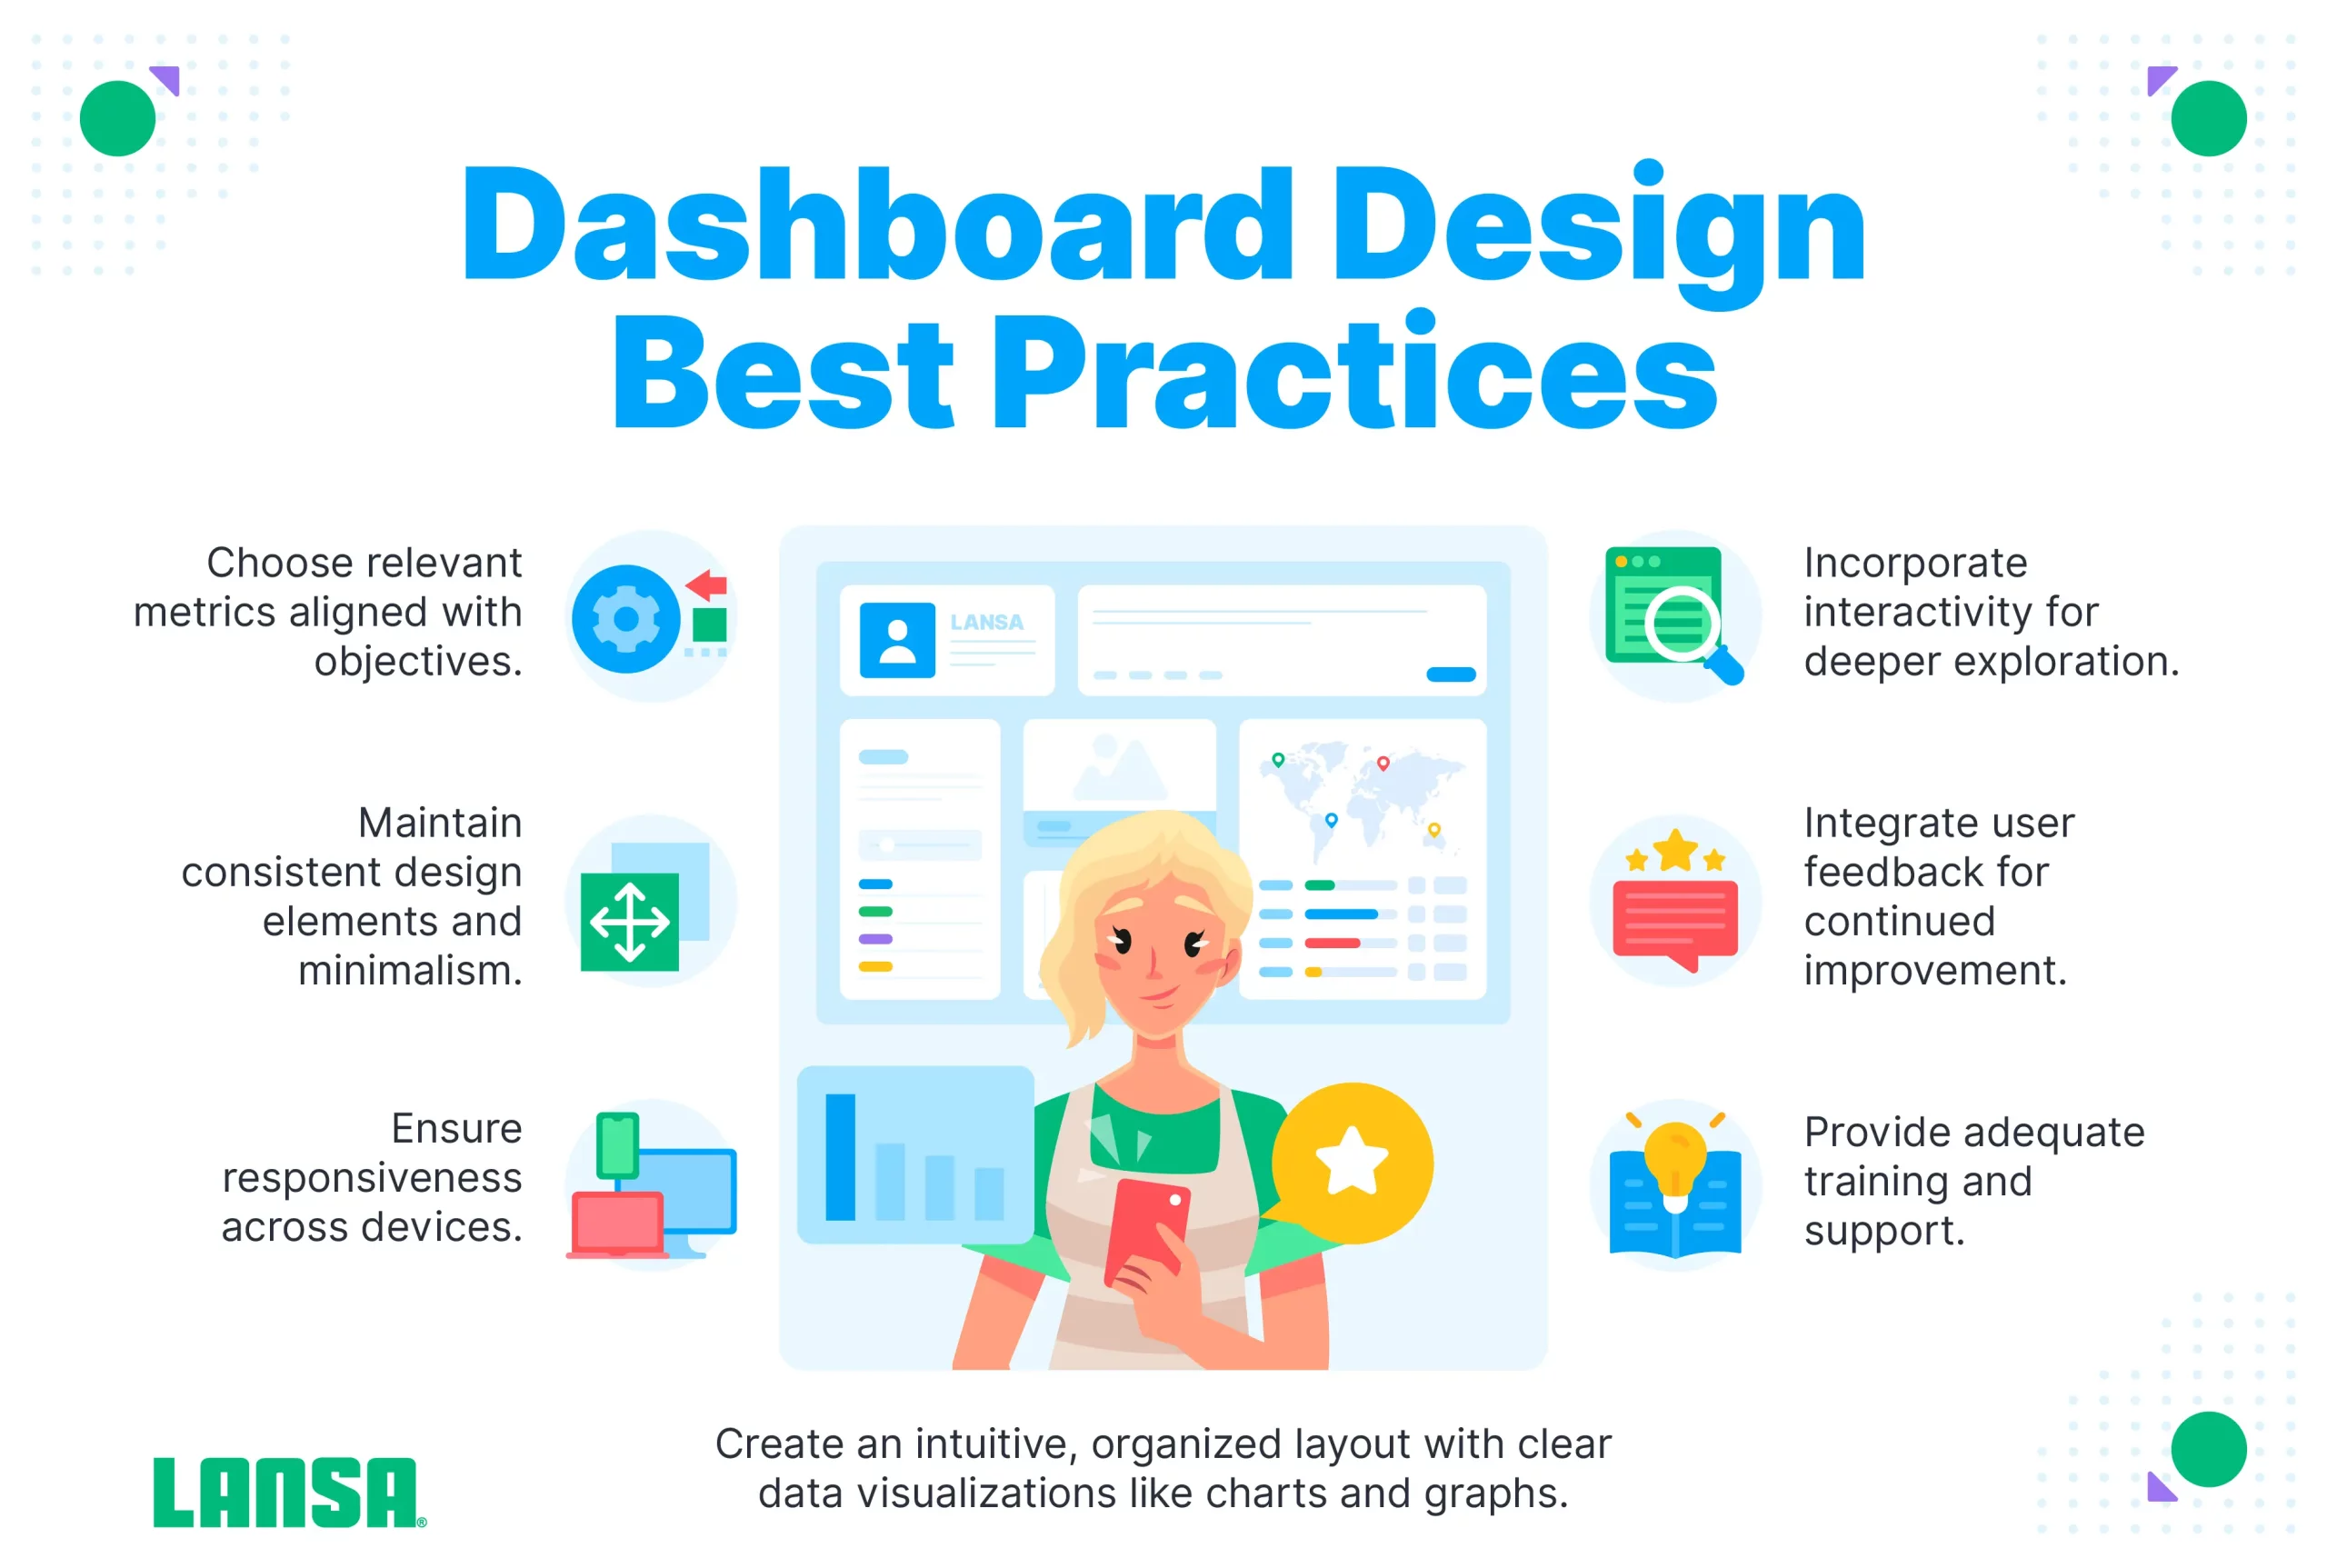
To design visually appealing and user-friendly dashboards, it’s best to:
- Choose relevant metrics. The metrics that best help you and other stakeholders do their jobs should be featured in your dashboards.
- Arrange metrics intuitively. The arrangement of your metrics should make it easy to understand how they relate to each other and help tell stories with data.
- Use clear data visualization. To make it easier for you and others to benefit from your dashboards, you should use charts, graphs, and widgets that clarify the narrative the data conveys. Best Practices for Business Intelligence Dashboard Design
Best Practices for Business Intelligence Dashboard Design
To design business intelligence dashboards, you should consider the following successful practices:
- Incorporate ideas from end users in your dashboard design process
- Make sure you keep your dashboards up-to-date
- Enable different departments to customize their dashboards
- Be precise when it comes to the data users should be tracking
- Don’t present too much information to users
- Keep user-experience considerations top of mind, testing your dashboards with users to pinpoint issues
- Adjust designs as you build them using an iterative strategy
BI Dashboard Examples and Use Cases
The best dashboard examples include pertinent information that’s immediately applicable for solving daily analytical challenges.
For example, suppose a chief operating officer (COO) wants to create an operational efficiency tracking BI dashboard. They could use it to monitor then optimize their company’s operational efficiency, using data from multiple departments.
For instance, the dashboard could integrate data from the company’s:
- Enterprise resource planning (ERP) system
- Supply chain management software
- Operational database, which contains data regarding the company’s inventory, customer interactions, and sales transactions
As the system integrates this data, it provides real-time insights into, production rates, inventory levels, the timeliness of shipments and order fulfillment processes, and the frequency with which support staff interact with customers.
Therefore, with a quick glance at the dashboard, the COO can identify issues that may be delaying orders or inhibiting production — and negatively impacting customers’ experiences.
In addition to providing real-time insights, the dashboard can also surface trends. For instance, if the turnaround time for fulfilling an order has been dropping by an average of 5% per month over the last six months, the COO could see this info on the dashboard and take steps to address it.
As another example, let’s say a sales manager decides to use a BI dashboard to monitor sales performance across multiple regions. As they build their BI dashboard, they could include data from offices and stores in New York, New Jersey, Boston, and Washington D.C. The data they integrate into the dashboard could come from:
- Sales databases, which contain historical sales and product data
- Customer relationship management (CRM) systems
- Point-of-sale (POS) terminals
Using their BI dashboard, the sales manager notices a drop in sales volume in the D.C. office in comparison to the other three locations. The manager then correlates sales data with the number of phone calls placed to highly qualified leads, using the data from CRMs. They notice that there’s a positive correlation between the number of calls placed to qualified leads and sales volume. Also, the number of calls placed to leads in the D.C. office has slumped as well.
Armed with this information, the sales manager can train those in the D.C. office as to when and how to make calls to highly qualified leads.
Key Takeaways
Your business intelligence dashboard is a powerful tool when you have to make sound, data-based decisions. As it pulls data in real time from different business systems, it gives you insight into your operational health so you can adjust your strategy accordingly. Using dashboards, you can customize the data you use and how you display it.
Using LANSA BI’s DB2 integration and support for embedded analytics in IBM I applications, you improve the quality of your data, enhance security, and streamline your data management. This enables real-time insights into IBM i applications. You also enable multiple team members to work with the same data simultaneously. As a result, it’s easier for your teams to integrate BI into IBM applications, enriching the analytical process. Reach out to our team today to learn more.
References
[1] D. Jebaraj, “5 Key Strategies for Making Data Visualization Accessible – DATAVERSITY,” DATAVERSITY, Feb. 23, 2024. https://www.dataversity.net/5-strategies-for-making-data-visualization-accessible/
[2] “Performance Dashboards,” Google Books. https://books.google.com.bz/books?id=rCt-FVy8PvcC&newbks=1&newbks_redir=0&printsec=frontcover&dq=business+intelligence+dashboard+benefits&hl=en&redir_esc=y#v=onepage&q&f=false
[3] “45 Amazing Business Intelligence Statistics for 2024,” Techjury, Jan. 02, 2024. https://techjury.net/blog/business-intelligence-statistics/
[4] D. Partida, “7 Pros and Cons of big data | Datamation,” Datamation, Jan. 12, 2024. https://www.datamation.com/big-data/big-data-pros-and-cons/#disadvantages