Business intelligence (BI) and data analytics are all the rage these days across numerous industries. From manufacturing to cybersecurity to human resources and engineering, business intelligence makes complex, analytical data easy to understand for the everyday user.
The history of business intelligence begins as early as the 1800s when author Richard Millar Devens cited a banker who gathered market intelligence before his competitors [1]. Armed with this unique intelligence, he acted on it to outsmart the competition. Evolving through the centuries, business intelligence as we know it grew in popularity in the 1990s, but it was incredibly complex and required information technology (IT) experts or developers.
Now, BI tools are revolutionizing the power of big data, putting it at the fingertips of the everyday employee. In this article, we will discuss:
What is Business Intelligence?
Business intelligence is the practice of turning data into actionable insights. Business intelligence combines data analytics, visualization, and infrastructure to help businesses make more data-driven decisions. The ultimate goal of business intelligence is to transform large, raw data sets into actionable insights that can be understood by anyone. As of 2020, the global adoption rate of BI was around 26%, with a primary objective to improve efficiencies [2].
How Does Business Intelligence Work?
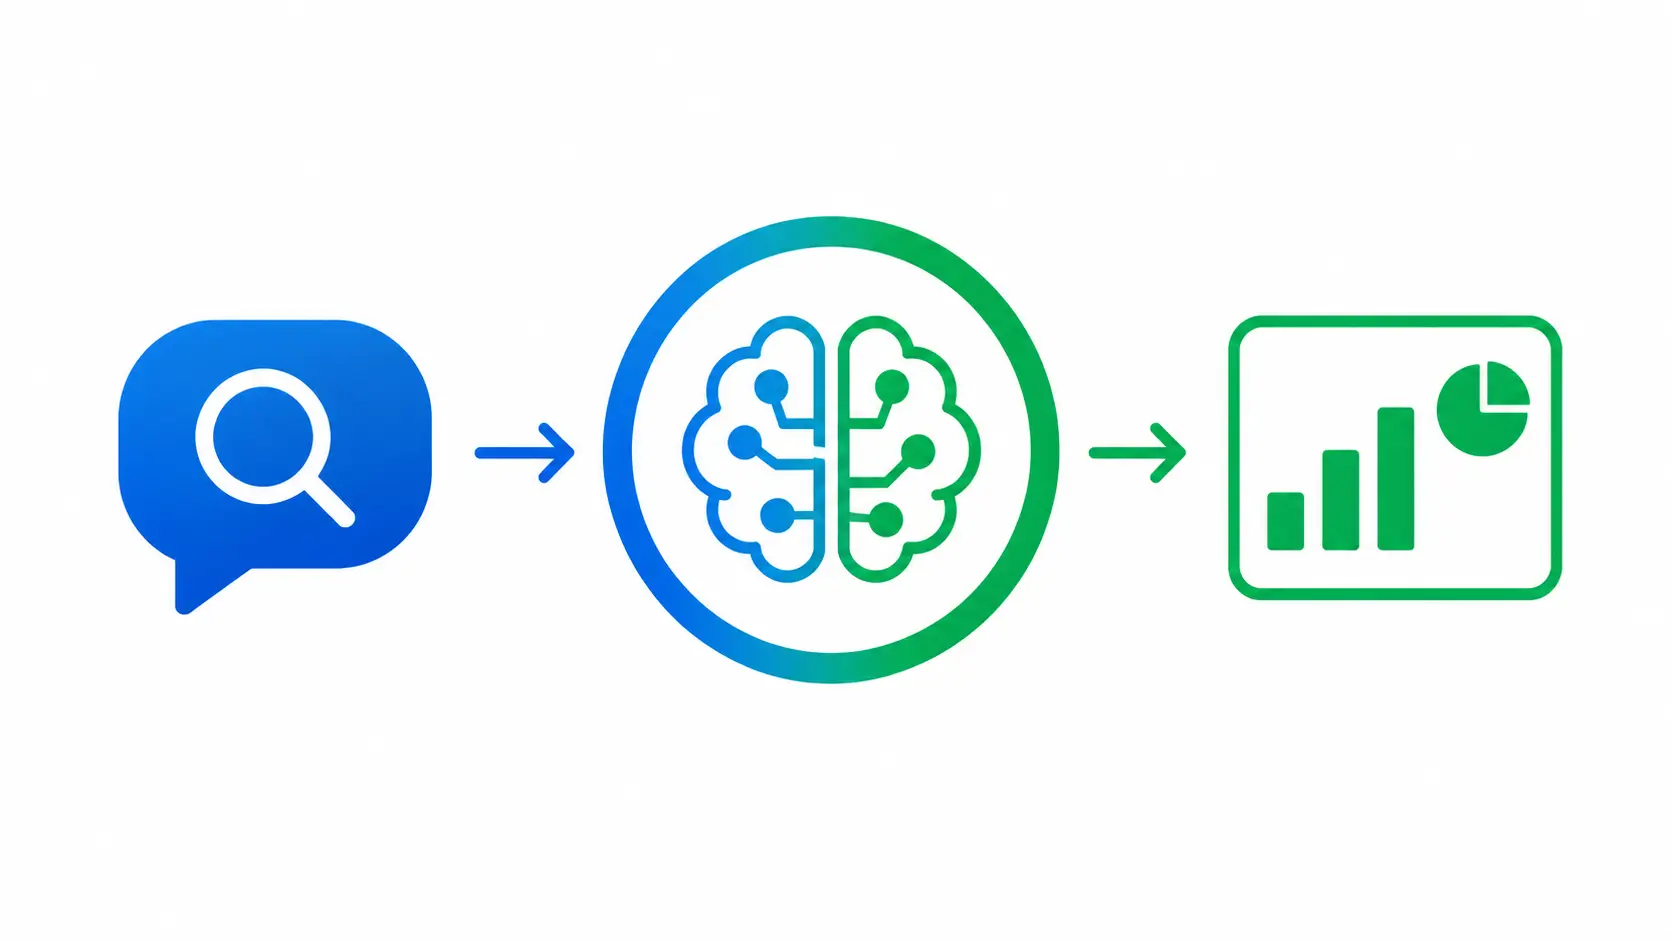
Business intelligence typically works in a multi-step standard process. BI platforms automate and perform much of this process, allowing human engineering and IT team members to support when needed. Below is a general overview of how BI works.
Data collection
To create graphs, charts, and other visual tools, data has to be gathered from various departments and sources within an organization. This data can come from spreadsheets, software-as-a-service (SaaS) platforms, and other databases, and it can also include both historical and real-time information.
Analysis
Once data is gathered from multiple sources, it needs to be organized and transformed into a consistent, standardized format. This includes basic data hygiene practices like cleaning up naming conventions, merging files, or correcting inconsistencies. Once data is in a unified format, it can be stored and processed, and infrastructure can be built underneath for further analysis.
Reporting
Business intelligence reporting is the end stage of business intelligence, what most people recognize as “BI.” Once data has been collected, cleaned, and analyzed, BI platforms can create highly valuable visualizations, showing trends, relationships, significant changes, and more.
Why is BI Important?
BI is so much more than colorful graphs and charts. Business intelligence plays a key role in driving data-driven decision-making, a critical business practice that offers a variety of benefits from increased efficiency to cost savings to increased employee productivity and, ultimately, a competitive advantage.
Without BI, companies risk losing ground to competitors and falling behind the innovation curve. Organizations also run the risk of missed opportunities and inefficient budget spending. It can also result in poor customer experiences, increased churn, and lost revenue.
Industries That Benefit From Business Intelligence
BI in Manufacturing
Some of the most interesting BI examples come from the manufacturing world. For SKF, a Sweden-based global manufacturer, 17,000 distributor locations created a mess of disorganized spreadsheets that made it difficult to forecast sales, inventory, and demand [3]. By investing in BI tools that create a single, centralized data repository, marketing, sales, and logistics teams across SKF can improve the planning process.
BI in Travel
BI enhances the ability of travel organizations to increase efficiencies, reduce operating costs, and create a more positive customer experience amongst razor-thin operating margins. For example, Delta Airlines invested heavily over the last few years into big data analysis and new applications for baggage collection, leading to a reduction of 71% in lost baggage since 2007 [4]. Similarly, Expedia adopted business intelligence software to provide detailed reports to its business-travel clients [5].
BI in Healthcare
Healthcare is one of the biggest industries right for opportunity when it comes to BI. BI is transforming patient outcomes, reducing nurse burnout, and allowing for collaboration amongst providers. For example, Clinical Decision Support (CDS) software provides prescriptive analytics to practitioners, supporting real-time alerts and analysis [6]. Collaborative tools are bringing together patient data, imaging, physician notes, and more to provide more holistic care and allow healthcare practitioners to work in sync. Especially across geographical zones, BI brings together the huge amount of healthcare data generated every day to create actionable insights, identify trends, and improve patient care.
BI Methods
Depending on your company’s goals and infrastructure, different BI methodologies and approaches might work better than others.
Data warehousing
In data warehousing, large volumes of data are stored, managed, and organized as structured data. Data is organized in a centralized repository, also known as a warehouse, and is designed to be neatly organized into rows and columns. This structure makes it easy to search and analyze, creating the foundation of data visualizations.
Data warehousing is an ideal BI method for large data sets that need a centralized, organized single repository.
Data mining
Data mining is a more active BI methodology, where various techniques and algorithms seek to uncover hidden patterns, trends, and valuable insights within large data sets. Data mining as a BI approach shines as it allows machines to extract meaningful information. It identifies sequences, clusters, or abnormalities when it comes to data.
ETL (Extract, Transform, Load)
ETL moves data from the original source to the centralized data warehouse while transforming it along the way. ETL builds consistency and ensures high-quality, clean data is sorted into the central repository. Data might be cleansed, validated, aggregated, properly formatted, or even enriched as it undergoes analysis before reaching the data warehouse. Then, data is properly “loaded” into the correct format and stored.
Business Intelligence Benefits
Adopting and implementing BI offers numerous benefits to organizations of any size in any industry:
- Increases customer satisfaction
- Improves operational efficiency
- Informed decision-making
- Transparency and visibility across departments
- Increases employee productivity
- Reduces manual efforts
- Facilitates strategic planning by proactively identifying trends, opportunities, and areas of improvement.
Read more about the benefits of business intelligence.
Challenges IBM i users face in harnessing business intelligence
For IBM i users, the power system is critical for organizations and industries that focus on reliability, efficiency, and security. However, IBM i users face a variety of challenges when it comes to harnessing business intelligence to democratize data visibility, empower individual users, and utilize data-driven decision-making [7]. For IBM i users, LANSA BI’s embedded analytics provide powerful real-time insights [8].
Hefty costs
Many IBM i users are concerned about the cost and complexity of implementing BI solutions. An on-premise BI implementation could cost an average of $200,000, including software, hardware, and infrastructure, but costs can also go significantly higher [9]. However, a solution for high costs is adopting a BI tool that is tailored to the IBM i platform so less integration and migration are needed.
Data fragmentation
IBM i users face a struggle with fragmented, siloed data across departments and databases. This causes a lack of standardization, which makes it difficult to pinpoint insights and trends and create action. Another solution to IBM i fragmented data is to adopt a BI platform that integrates seamlessly with IBM i. This allows users to unlock insights and enable more informed decision-making.
Hard-to-visualize charts and graphs
IBM i houses huge amounts of data for organizations, but in its raw form, it’s not helpful or actionable. With a tool like LANSA BI, natural language query allow users to express their ask in everyday language, and the system will intelligently respond with data. Once business intelligence dashboards and visualizations are created, each individual end-user can analyze thousands of data points at a glance [10].
Security concerns
IBM i users also worry about security issues when it comes to integrating with new platforms and applications. Especially with the sensitive, confidential nature of data, any third-party integration, potentially puts that security at risk. With a business intelligence tool like LANSA BI that embeds analytics directly into existing IBM i applications, it reduces the risk of unauthorized users along with potential vulnerability concerns.
BI Trends
As we mentioned above, business intelligence has come a long way since its earliest iterations. As companies’ BI strategies mature, more sophisticated data analytics tools are created, and artificial intelligence reaches the masses, the BI landscape is looking different every year.
The emergence of self-service analytics
Gone are the days of companies relying on IT experts or developers to harness business intelligence. Not only did this keep data trapped within engineering spheres, but when team resources or bandwidth was short, BI would often fall by the wayside. Now, companies aim to democratize data and BI, improving accessibility, making data user-friendly, and overall reducing IT dependency. With self service analytics, even the most non-technical employee can create their own reporting dashboards to drive their decision-making. Not only can I create their own visualizations, but they can optimize and tweak them.
Embedded analytics
The concept of embedded analytics is another emerging trend that powers users to access and analyze data independently. Context-enriched analytics bring visual dashboards outside of the BI platform and place them where the user needs them. The embedded analytics market itself is expected to reach $77.52 billion by 2026 [11].
With embedded analytics, users get real-time contextual analysis directly within their normal workflow. It reduces the back and forth between platforms and allows data to become more easily used.
Low-code applications
One of the biggest blockers when it comes to BI adoption historically revolved around the need for software code and software developers. Now, low-code BI platforms create a user-friendly approach that requires little to no coding. Instead of complex programming languages, users can interact in visual, simple environments that use tools like drag-and-drop modules, pre-built templates, intuitive user interfaces, and more. Once again, this empowers the everyday user to harness data, create their own reports, and iterate on their own tools to finesse the data.
Steps to Developing a Successful Business Intelligence Strategy
Developing and implementing a BI strategy is not something that’s done overnight. It involves both a culture and mindset shift for your organization, executive Biane from the top down, and a restructuring of how your company prioritizes data. Below is a quick step-by-step guide for organizations to implement an effective BI strategy:
- Understand Business Goals
- Identify Stakeholders
- Choose BI Tools and Platform
- Form BI Team
- Define Project Scope
- Prepare Data Infrastructure
- Set Goals and Roadmap
Types of BI Analysis
Depending on what data you’re looking for and what insights you’re trying to glean, different types of BI analysis might be more useful than others. Also, different approaches work well together to look at past, present, and future states to create a comprehensive picture.
Predictive Analytics
Predictive analytics uses historical data to make informed predictions about future trends and outcomes. Using machine learning and artificial intelligence, patterns are identified that might predict future behavior. With predictive analytics, companies can optimize existing products, better understand customer behavior, and even improve pricing strategies.
Descriptive Analytics
Descriptive analytics looks at past data to gain insights into current trends and performance. Descriptive analytics paints a picture of what happened in the past, while on the other hand, predictive analytics makes an educated guess on what might happen in the future. Descriptive analytics focuses more on data monitoring and post-mortem analysis.
Prescriptive Analytics
Prescriptive analytics are a more advanced form of BI that not only analyzes data but also recommends the best course of action. For example, a venture capitalist firm might use prescriptive analytics to make investment decisions instead of relying solely on financial advisors’ decisions.
Types of BI Tools and Solutions
Just as there are different types of data analytics, there is a multitude of BI tools and solutions to choose from. From simple spreadsheets that most people are familiar with to complex reporting software, all of these different BI tools play a role in creating a broader data-driven culture. Let’s take a look at some of the most popular solutions below.
Spreadsheets
Spreadsheets are familiar and versatile; in BI, they offer a great amount of versatility in data, reporting, and analysis. Even in the most advanced and cutting-edge data environments, spreadsheets act as a data collection tool while also providing valuable reporting and analysis.
Reporting software
On the other hand, reporting software is a step up from basic spreadsheets. Reporting software works well in the overall BI strategy when it comes to simplifying data presentation, making it more accessible and visual to a wider audience.
Data visualization software
Data visualization software works specifically to streamline and clarify using charts, graphs, and dashboards. This helps users interpret complex data, quickly identify trends, and, like reporting software, make data more accessible to the everyday user.
Data mining tools
Data mining involves powerful statistical and mathematical tools to sift through huge data sets to discover patterns and insights. Data mining sorts through multiple databases and software to help businesses understand their customers, pinpoint anomalies, and proactively adjust to trends.
Online analytical processing (OLAP)
OLAP is more commonly known as slicing and dicing. It involves splitting multi-dimensional data into two dimensions. This computing tool processes huge amounts of data from a single repository to export into multiple categories. It facilitates a multi-dimensional model that makes it easy for users to use their data in everyday life.
The Future of Business Intelligence
Most companies are just at the tip of the iceberg when it comes to harnessing the power of business intelligence. From embracing augmented technology, like algorithms and machine learning, to creating AI-enabled technologies of their own, as more and more corporate data is created, more BI tools will be needed.
By 2023, more than 33% of large organizations will utilize advanced BI analytics to make smart decisions faster [13]. Plus, as companies adopt self-service and embedded analytics, employees from every department will begin using data as a part of their everyday workflow. Data literacy will increase, and these powerful technologies will continue to become even more prevalent.
Key Takeaways
Over the next decade, the companies that prioritize BI strategies will maintain their competitive edge, continue to innovate, and pull ahead of the pack. Business intelligence is no longer a nice to have, but it’s a critical tool for harnessing the power of big data to increase accessibility and visibility across organizations.
Forward-thinking organizations can develop BI strategies that work best for their data architecture, business needs, and goals through different BI methods like data warehousing or data mining. They can use different types of BI analysis, including predictive analytics, descriptive analytics, and prescriptive analytics, to create a comprehensive picture of their business.
For IBM i users, actionable BI is harnessed through an IBM i business intelligence platform like LANSA BI. LANSA BI leverages smart, user-friendly tools to build transformative insights through a native DB2 database integration. Tools like embedded analytics, natural language queries, assisted insight generation, and business intelligence dashboards create easy and accurate data-rich experiences.
To learn more about LANSA BI for seamless data integration and transformative analytics, register for our free webinar here, or contact our team.
References
[1] https://www.dataversity.net/brief-history-business-intelligence/
[2] https://wiiisdom.com/ebook/business-intelligence-trends-2020/
[4] https://d3.harvard.edu/platform-digit/submission/big-data-takes-flight-at-delta-air-lines/
[6] https://www.datapine.com/blog/big-data-examples-in-healthcare/
[9] https://www.grow.com/blog/can-an-enterprise-bi-be-expensive
[10] https://lansa.com/blog/business-intelligence/choosing-the-best-business-dashboards-for-your-project/
[11] https://www.alliedmarketresearch.com/embedded-analytics-market
[12] https://techjury.net/blog/business-intelligence-statistics/