How well do you understand what makes your clients’ businesses tick? Even the most thoughtful, detail-oriented experts need data to make decisions. This is why 57% use big data to drive their innovation initiatives [1]. If you’re a business intelligence professional, IT manager, or analyst, a BI tool enables you to create an intelligence and analysis system that collects, organizes, and presents data that powers confident decisions.
Key insights
- Even if you don’t specialize in advanced analytics, business intelligence tools empower you to discover and analyze actionable data to spurn growth and address concerns.
- Using BI tools, you can centralize all your business data, providing deeper visibility to all decision-makers who have access to your solution.
- In addition to accessing and analyzing data, business intelligence tools enable you to make predictions, automate processes, discover ways to reduce costs, and gain a competitive advantage.
- LANSA’s IBM i business intelligence software enables you to incorporate real-time analytics in your IBM I applications by giving your pre-built business intelligence solutions
Read on to learn more.
What Are BI Tools?
BI tools gather, process, and analyze data from a combination of external and internal systems. In the context of this BI tools definition, you can run the data through the top BI tools to produce more effective insights, whether the data is structured or unstructured.
What is a BI tool when it comes to the data you can process? The best BI tools make it possible to work with a variety of data, including documents in different forms, images, social media posts, and a range of files. Your tool can mine, visualize, analyze, and help with BI reporting. BI solutions also enable you to present data in easy-to-understand formats, such as charts, graphs, and BI dashboards, so it’s more actionable for stakeholders.
Why Use Business Intelligence Tools?
One of the most important reasons to use business intelligence tools is for data discovery. Even though the data discovery process used to be accessible only to advanced analytics pros, the best BI tools enable discovery even for those without a data science background.
In addition to discovering business-critical data, you can leverage BI tools to enable faster growth with fewer setbacks.
Download our whitepaper to learn how IBM i organizations are modernizing BI while strengthening enterprise-grade governance.
For instance, many use BI solutions to monitor business performance over time. In this way, you can identify trends that may indicate issues such as wasteful spending or the inefficient use of human or monetary resources.
Others use BI tools to gain insights into customer behavior or preferences. With this data in hand, you can adjust your product or service, design promotional packages that meet customers’ needs, and even predict how they may respond to new product launches or advertising campaigns.
BI Tools Benefits
Using BI tools, you can improve your strategic decision-making and make faster progress towards your goals.
Centralized Data
With a BI tool, you have all of your most important data in a central location. Businesses gather data from customer relationship management (CRM) solutions, databases, enterprise resource planning (ERP) software, and other business apps. Using BI tools, you collect the data and then make queries that reveal analytical insights, such as operational issues, sales trends, or ways to boost efficiency.
Data-driven Decisions
BI tools make it easier to make data-driven decisions because they provide you with centralized, actionable information. Instead of having to rely on gut instinct or intuition, you can use BI tools to present data to other decision-makers, those who control budgets, executives, and employees.
For example, suppose a software-as-a-service (SaaS) provider wants to foster longer-term relationships with its customers. Using a BI tool, strategists can collect data from the company’s subscription management system, CRM, and accounting software. The tool can draw data from these solutions to reveal which salespeople have the most success in securing longer-term subscriptions. Strategists could then set up a meeting with these professionals to figure out what makes them so successful. Their input could then be used to develop a set of best practices for scoring more long-term subscriptions.
Prediction Making
Because BI tooling gives you access to a bevy of data — both historical and current — it enables a predictive analysis and forecasting system. Using data from how a product or service performed in the past, you can better estimate how it may fare in the future.
At the same time, BI tools can also help you identify changes in business conditions so you can stay a step ahead, formulating a strategy to mitigate the effects. Further, you can enter hypothetical data to model what may happen if business conditions shift down the road.
For instance, you can answer questions such as:
- If we cut back our workforce by 15%, how may that impact production output?
- If shipping costs go up by 12% next year, how may that affect our profitability?
- If we choose a different supplier for our components — one with a longer fulfillment time but less expensive prices — how would that impact our ability to deliver products to customers?
Automatization
BI tools give you the ability to automate elements of your business intelligence system using rules that provide alerts and surface analytical insights.
For instance, suppose you want to know when production levels drop below a certain threshold. It can be time-consuming to manually comb through data and calculate production rates in relation to time. But by using a tool like LANSA BI, you can automatically monitor production metrics and even see why your productivity has fallen below acceptable levels.
Reduces Business Costs
Since your BI tool can analyze so much data, it paves the way for reducing costs across your operational landscape. For example, you can examine customer buying behavior and figure out ways to streamline the sales process. You can also monitor processes in real time and see how much each process costs your company.
Also, because you have access to so much data, you can formulate more cost-effective strategies as you plan your next steps. For instance, as your BI tool reveals which products or services deliver the best revenue to cost of goods sold (COGS) ratio, you can choose to prioritize these instead of those that cost more to produce.
Competitive Advantage
As you vie for a more dominant position in the marketplace, BI solutions can enable data-based strategies to help you get a leg up. For instance, as mentioned above, if your COGS is too high to offer competitive pricing, you can use a BI tool to analyze costs and find ways to reduce your per-unit expenses.
When used in the lead acquisition and nurturing process, a BI tool can surface underperforming demographics. With that data, you can develop a strategy for better meeting these customers’ needs, gaining an edge over your competition in the process.
What Makes a Great BI Tool?

- Easy to Use and Intuitive: A great BI tool should have an intuitive interface that allows users to easily navigate through the system, access data, and create reports without extensive training or technical expertise.
- Data Integration Capabilities: It should be able to seamlessly integrate data from multiple sources, including databases, spreadsheets, and cloud applications.
- Powerful Analytics & AI: The BI tool should offer robust analytics capabilities, including data visualization, predictive modeling, and advanced analytics such as machine learning algorithms, to uncover insights and trends within the data.
- Customization and Flexibility: A great BI tool should allow users to customize reports, dashboards, and data visualizations to suit their specific needs and preferences, enabling them to tailor the tool to their unique business requirements.
- Data Security and Governance: Data security and governance are paramount in BI. A great BI tool should provide robust security features to protect sensitive data, as well as compliance capabilities to ensure adherence to regulatory requirements such as GDPR or HIPAA.
- Collaboration Features: It should facilitate collaboration among users by allowing them to share reports, collaborate on analyses, and annotate insights, fostering a culture of data-driven decision-making within the organization.
- Cost-Effectiveness: Last but not least, a great BI tool should offer good value for money, providing a balance between functionality, performance, and cost to ensure a positive return on investment for your organization.
What Are the Top Business Intelligence Tools?

While there are many tools for business intelligence, the following BI tools list features the top five solutions:
LANSA BI
LANSA BI, one of the easiest-to-use business intelligence tools, gives you business intelligence reports via native DB2 database integration with IBM i applications. It provides you with a user-friendly BI solution that enables workflow optimization, increased profits, and higher customer satisfaction ratings.
To enable more in your organization to perform data analysis, LANSA BI gives you self-service data extraction via guided NLQ, as well as AI-assisted reporting. This empowers everyday users to do what they’d normally need data analyst support to accomplish. For example, you can select several KPIs for two different business locations, and then use LANSA BI’s Compare function to analyze them side-by-side. LANSA BI then instantly develops reports for each of the KPIs, including charts and natural, easy-to-understand language that you could read straight from the screen during a meeting.
Learn how to integrate BI into Your IBM i Applications.
Watch our webinar to find out more.
Key Features
LANSA BI gives you the ability to embed analytics in your IBM I applications. It also gives users the freedom to execute natural language queries so they can get the answers they need even without having to be well-versed in a coding language.
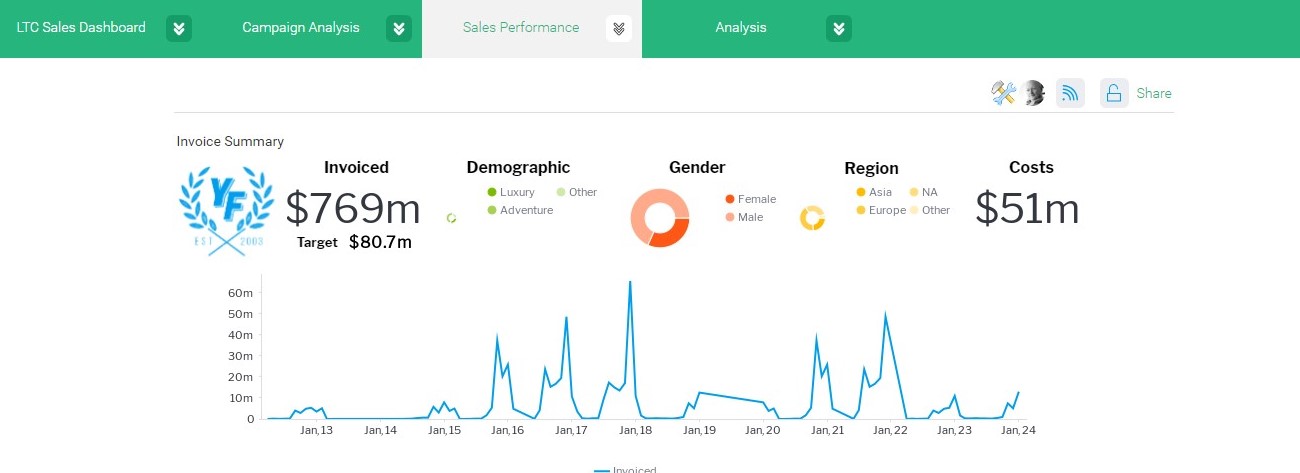
LANSA BI also provides you with business intelligence dashboards so you can visualize your insights in charts without having to code anything. With its integrated AI, LANSA BI can help you derive insights from big data and set up straightforward automation.
As one of the top BI tools, LANSA gives you the ability to:
- Embed analytics directly inside your IBM i applications
- Execute natural language queries
- Use a few clicks to generate AI-powered reports
- Visualize a comprehensive range of business data in a single, customizable dashboard
Pros
- Intuitive, straightforward analytical tools anyone can use
- CustomizeCustomizableable dashboarding for simple reporting for many disciplines
- AI-assisted insights for faster, more insightful reports
Cons
- The user interface may take some getting used to if you’re accustomed to legacy, manual BI software
Tableau
Tableau gives you a data discovery and visualization solution in three different forms: Tableau Desktop, which works for general users; Tableau Server, which is designed for organizations; and Tableau Online, which is a hosted analytics solution for organizations.
Key Features
Tableau has a customizable dashboard that gives you insight into whichever metrics you set up. You can also use Tableau to analyze performance relating to specific tasks, users, and groups of users.
Tableau is one of the top BI tools because it has:
- A customizable dashboard
- Diverse visualization options
- Good customer support
Pros
- A variety of forms for different kinds of users
- Customizable dashboard
- Useful, user-friendly visualizations
Cons
- More expensive than several other BI options
- Inconsistent customer support
- Relatively limited BI functions
Power BI
Microsoft Power BI is one of the most commonly used BI tools and typically appears on a list of BI tools. It provides you with web-based analytics and visualization capabilities. Using Power BI, you can spot trends as they develop and then take appropriate action. Power BI also gives you the freedom to integrate data from your business apps so you can monitor performance in real-time.
Key Features
Power BI is often seen on a business intelligence tools list because it enables you to connect to a variety of data sources, as well as clean and transform data prior to analysis. It also gives you data modeling capabilities so you can establish relationships between disparate data tables and use these to automate insights.
Power BI is often seen on a business intelligence tools list because it enables you to:
- Connect to a variety of data sources
- Clean and transform data prior to analysis
- Model data for establishing relationships between disparate data tables
Pros
- Inexpensive — free for single, personal use
- Relatively easy to use
- A consistent stream of updates from Microsoft
Cons
- Cluttered, unintuitive user interface
- Low data limits for free versions
- Limited options for customizing visuals
Datapine
Datapine provides you with interactive dashboards in a central location so team members across your business can make data-informed decisions. Datapine specializes in providing unique dashboards for specific business functions, such as finance, marketing, sales, management, HR, and more.
Key Features
Datapine has self-guided tools that help those new to BI set up their own analytical modules. It also enables you to drag and drop data fields into your reports to speed up the analytical process. You can also use intuitive data filtration, filtering out distracting information so you can focus on the most important data.
- Straightforward, self-guided tools
- Drag and drop reporting
- Intuitive data filtration
Pros
- Relatively intuitive animations
- Easy to combine multiple metrics in one interface
- Simple customization
Cons
- Steep initial learning curve
- No tutorials to make it easier to use its features
- A short, 14-day trial period
Key Takeaways
Using BI tooling, you can discover, analyze, and report on data across your organization. The best business intelligence tools also empower you to integrate data from multiple business apps, so you don’t have to navigate between solutions to leverage their information. The key to getting the most out of top business intelligence tools is to get one that is user-friendly so even those who don’t have advanced analytics skills can use them.
With LANSA BI, you can create customized reports using a combination of local and remote views, depending on which is most relevant to the user’s analytical needs. With LANSA, anyone, regardless of technical expertise, can drag and drop their way to deep analytical insights. Connect with one of our regional offices or fill out an online contact form to learn more.
References:
[1] “Topic: Big data,” Statista, Jan. 10, 2024. https://www.statista.com/topics/1464/big-data/#topicOverview