As the digital transformation continues to unfold, the generational shift has already occurred or is currently ongoing in virtually all fields of technological and software industries. Even though there is certainly no shortage of issues and challenges arising in the process, software development gradually gets more and more functional, accessible and agile.
Analytics and reporting tools, that always were an important component of software development technology stacks, are undergoing a generational shift as well. Complex solutions that required users to write code and have a considerable technical knowledge to use them, are now a part of software legacy that is being replaced by the new generation of products.
What is the role of data analytics and reporting tools?
Analytics and reporting tools are used to process raw data, summarize and organize it, displaying information in a visually attractive, easily digestible manner.
Today, the importance of data analytics and reporting is widely emphasized and well-communicated in the business environment. Of course, the benefits of collecting, analyzing and displaying various kinds of data have always been reasonably clear. But the actual level of technological development provided organizations with very limited capabilities to really unlock the potential of data.
Software analytics and reporting solutions emerged as part of the very first components of enterprise IT infrastructure, and are going up the evolutionary road along with the rest of technologies. Like original IBM i business applications and other tools that were designed and implemented decades ago, old software analytics solutions today can’t match the requirements of the new digitization era. And just like legacy IBM i apps, without full-scale modernization, analytics and reporting tools restrict organizations’ ability to get maximum value from their data.
How to know when your analytics and reporting tools need modernization?
The following are several fairly straightforward signs of using legacy analytics and reporting tools. They are easy to identify by problems and challenges that commonly arise in the process.
Limited functionality
Old analytics and reporting products typically have only the most basic features and capabilities. They don’t support the latest technologies, which are essential for such products in the modern business environment.
Outdated and unattractive visuals
As any legacy software, outdated analytics and reporting tools look old, with interfaces and visuals elements that were top-notch a few decades ago and distinctively unattractive today.
Hard to use
Excessive complexity and high technicality are also typical for software analytics designed when software only had to provide functionality, without needing to support it with proper accessibility and user-friendliness.
Costly to build and maintain
You can also distinguish legacy solutions by looking at them from the financial point of view, as they tend to require significant expenses for the development and maintenance. In order to function and deliver value, organizations typically needed to build them in-house, allocating considerable internal resources for the support of such a product over the years.
In a nutshell, problems and challenges caused by analytical and reporting tools that belong to previous generations of technological development are very similar to the issues with legacy business apps. And they also require modernization with pressing urgency in today’s dynamic business environment.
The good news is that a new cycle of technological evolution has brought us a fresh new generation of products to replace the legacy.
The new generation of analytics and reporting tools
No surprises here: the evolution of analytical and reporting tools is going in the same direction as the industry as a whole. They are getting much easier to set up and use, strive for seamless integration, and rely on low-code and no-code technologies to be accessible to non-technical people.
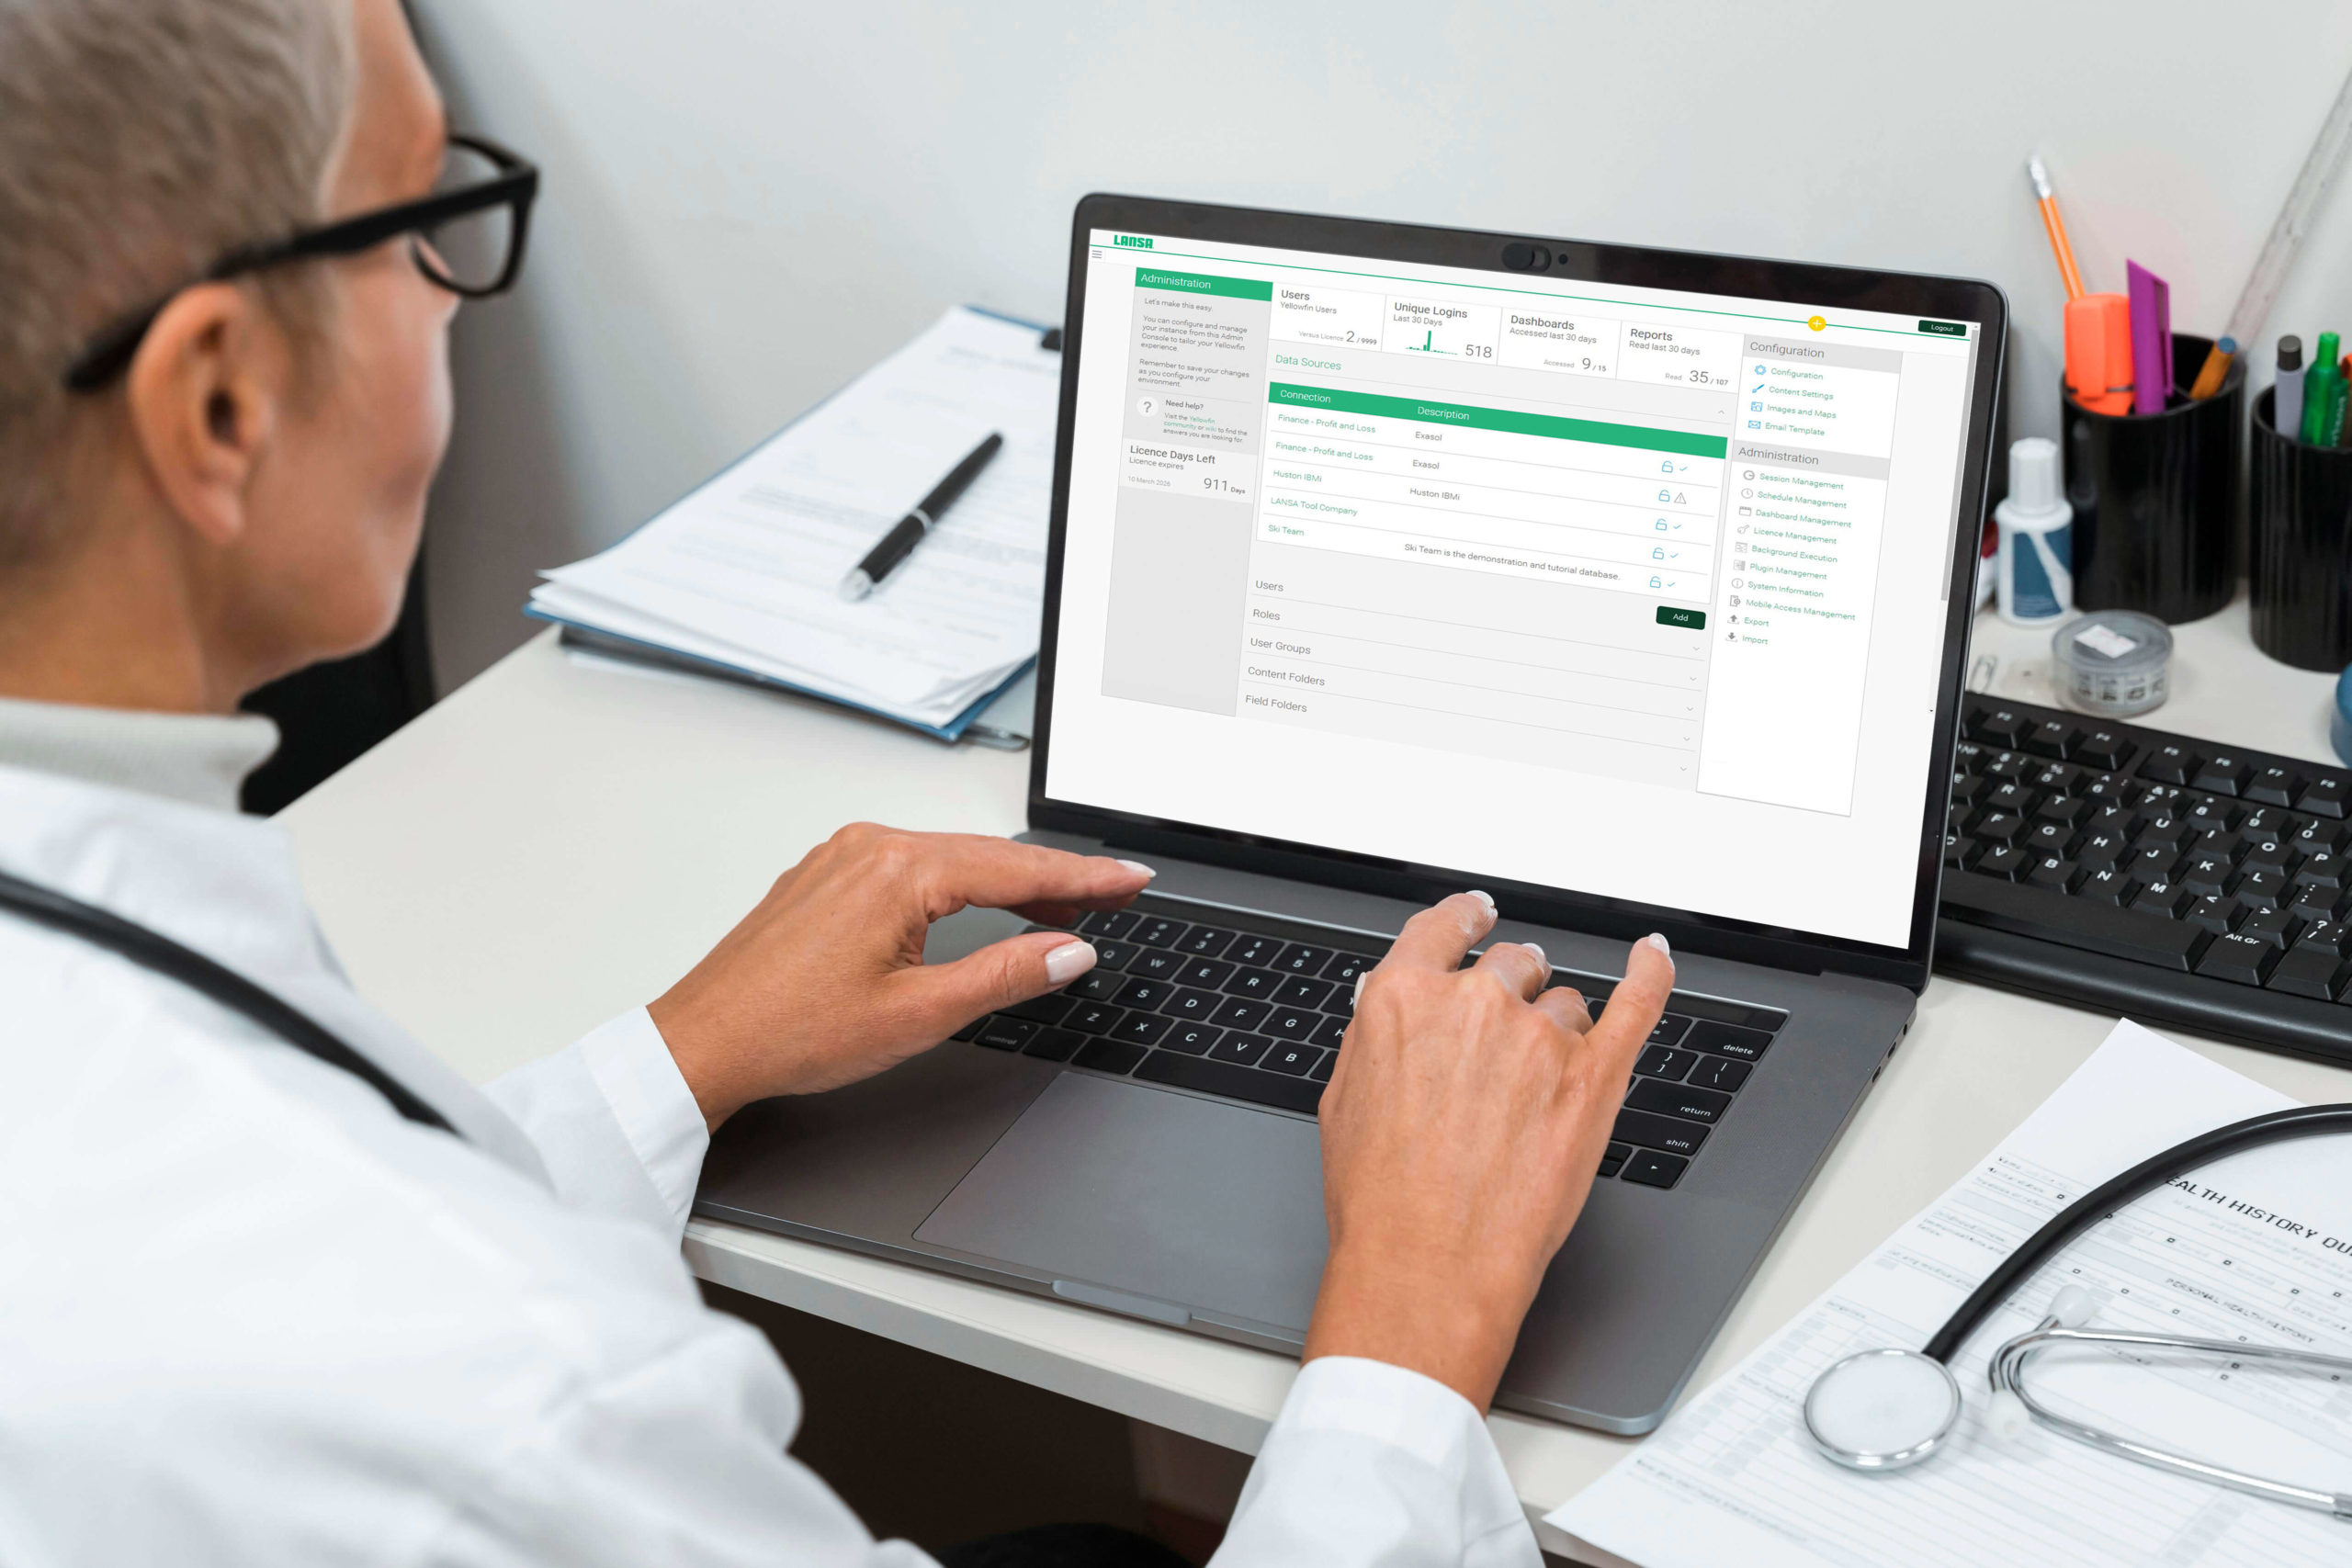
Yellowfin is the solution that encapsulates all the accomplishments the new cycle of evolution in analytics technologies has to offer. Yellowfin is a web-based business intelligence platform that deploys on-premises and in the cloud via the Amazon and Azure marketplaces
Here are some features and technical capabilities that make Yellowfin just the right choice for analytics and reporting tools modernization.
Automated monitoring
Yellowfin allows users to implement automated real-time monitoring with threshold-based alerts or fully automated AI-driven signals.
Action based dashboards
The platform provides embedded operational workflows using a no-code/low-code development environment, enabling users to create impactful dashboards and data visualizations.
Self-service business intelligence options
Yellowfin provides self-service BI options to accelerate discovery and allow anyone to create reports in a governed way.
Data stories and management reports
This tool helps organizations to reduce the amount of time it takes to tell insightful data stories with rich data visualizations, and build professional data-driven management reports and presentations fast and with little effort.
How do I modernize legacy Db2-based data management with LANSA and Yellowfin?
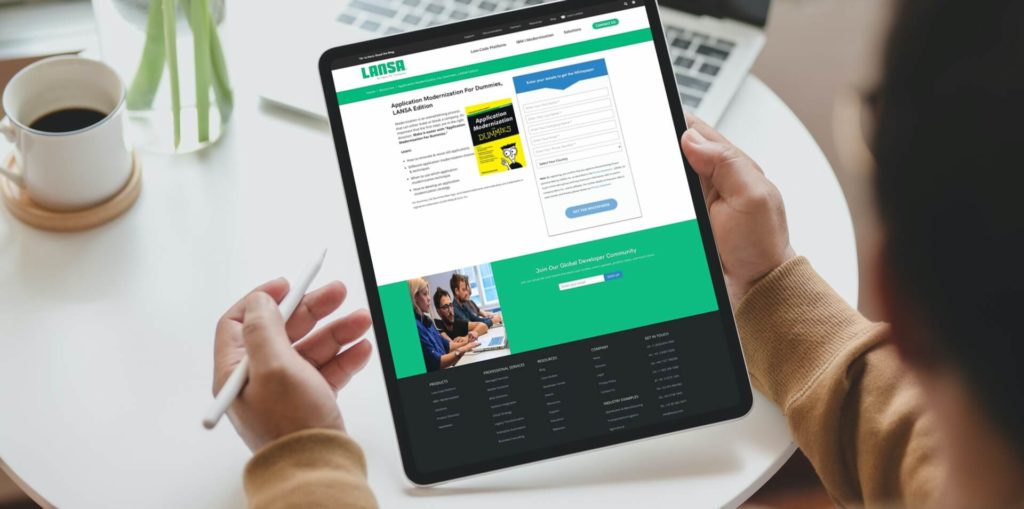
As you may or may not know, LANSA is one of the oldest and most experienced IBM i support providers (since 1987), offering a low-code application development platform and a large selection of tools for IBM i legacy application modernization.
Knowing about all the aspects of IBM i modernization projects first-hand, we are well-aware that modernizing legacy analytics and reporting solutions used in IBM i systems can be a long and highly problematic process.
And, in our opinion, Yellowfin is the just the right solution for organizations that are struggling to modernize legacy Db2-based data management with modern and powerful technology.
Supporting both REST and SOAP-based communications, Yellowfin can be easily added to the Visual LANSA platform, augmenting its already unmatchable arsenal of legacy modernization solutions with next-gen analytics and reporting.
Visual LANSA
Visual LANSA, a powerful low-code development platform. Visual LANSA enables accelerated application development by simplifying processes and minimizing the technical skills needed to develop apps. Using Visual LANSA allows organizations to build and deploy new PWAs rapidly and with minimum resources. In fact, it often takes only a few days from a project’s start to the successful deployment of a PWA.
Using the Visual LANSA platform delivers proven and well-documented results. In some cases, it increases development productivity by 10X or more. This is because Visual LANSA allows organizations to turn any programmer into a full-stack developer. More importantly, developers don’t have to master and support a dozen different languages and server technologies. With LANSA, they use the same language and IDE for all parts of an application—client-side, server-side, and everything in between. This increases the speed and cost-efficiency of the development process.
The LANSA platform makes using REST APIs and integrating them into new apps as easy as possible. Here is a sample code as an example.
Executing the Google Geocode REST API from within Visual LANSA:
Define_Com Class(#XPRIM_HttpRequest) Name(#Req)
Define_Com Class(#XPRIM_RandomAccessJsonReader) Name(#Reader)
#Req.DoGet Url(‘https://maps.googleapis.com/maps/api/geocode/json?…’)
* Check if request is successful
If (#Req.Response.IsSuccessHttpStatusCode)
* Set the JSON reader source for response from the HTTP request
#Reader.SetSourceHttpResponse HttpResponse(#Req.Response)
* Navigate to the ‘location’ object (containing the ‘lat’ and ‘lng’ values)
* We’ll specify a navigation path to navigate to the ‘location’ element
* Names and indexes in a path are separated by forward slashes
#Reader.BeginObjectWithPath Path(‘results/1/geometry/location’)
* Get the latitude and longitude value
#Latitude := #Reader.ReadNumberWithName(‘lat’)
#Longitude := #Reader.ReadNumberWithName(‘lng’)
* Close “BeginObject” with “EndObject”
#Reader.EndObject
Endif
To make this task even less challenging for organizations and teams, read the detailed and extensive documentation covering all the aspects of this process available for all Visual LANSA users.
No need to postpone modernization of IBM i analytics and reporting tools any further
Want to test how the new generation of analytics and reporting tools feels like first-hand? Yellowfin provides users with a free trial. Submit your details on this page to get the free access to Yellowfin.
Interested to learn more about LANSA’s solutions for quick and affordable IBM i legacy apps modernization? Get in touch with us to start utilizing Visual LANSA in combination with Yellowfin for your app development and modernization needs.